2024 U.S. Elections – Traders Should Keep an Eye on Volatility
Following the recent interest rate shift in the United States, the most important event of this year is approaching in early November: the presidential election in the United States. While political impacts may be short-lived in other countries, the influence of the election outcome across the Atlantic on Wall Street is significant. Ultimately, the U.S. election is likely to receive considerable attention worldwide. For traders, volatility is particularly interesting. It's not only high in election years but is likely to increase sharply just before the election.
Investors Dislike Risk
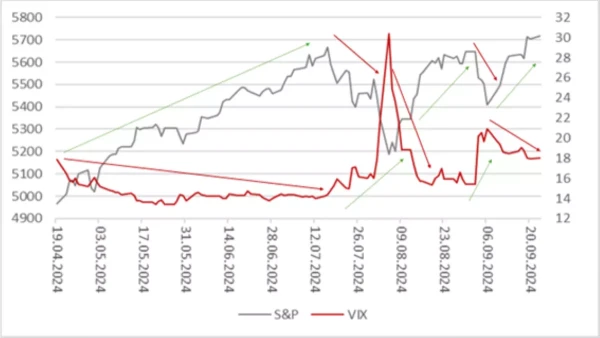
Volatility is often referred to as the "fear index", and for good reason. As historical volatility rises, so does market risk. And as is well known, investors don't like this. The relationship between the VIX volatility index and the S&P 500 is clearly visible in the first graph. As volatility increases, Wall Street declines and vice versa. Recently, volatility has been slightly declining.
Inverse relationship between S&P 500 and VIX volatility index

Historical Dependency Between S&P and VIX
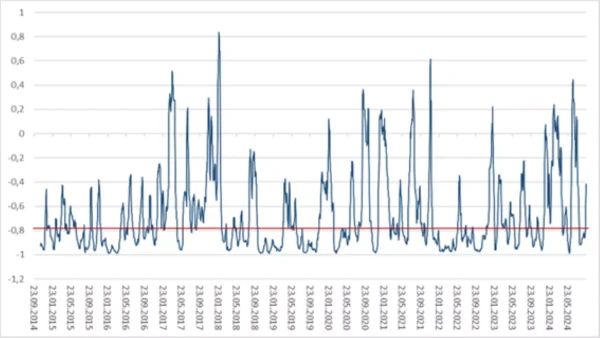
The dependency between the S&P price trajectory and volatility can also be mathematically determined. This is done using correlation. This statistical measure indicates the extent to which data series A (volatility) influences data series B (S&P). In the case of volatility, historically there is a so-called inverse correlation. As volatility rises, prices on the New York Stock Exchange fall, and of course vice versa. The second chart shows the correlation between the S&P and the VIX over the last twelve months. And below this lines we can see the correlation of the past thirty days. On average (median), the measure is -0.79. Such high values are considered statistically significant. And the high value suggests that a significant change in volatility will have a major impact on Wall Street activity.
30-day rolling correlation between S&P 500 and VIX

Volatility Rises Before the Election
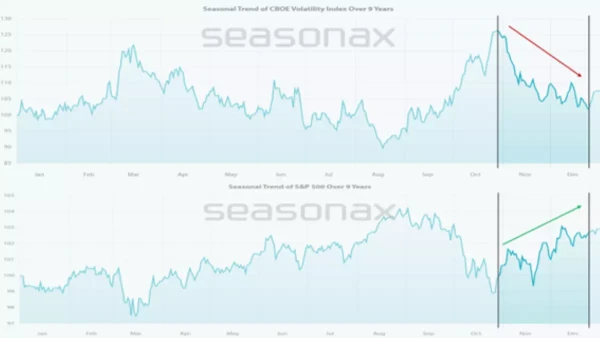
Let's now turn to the possible course of volatility immediately before and after the U.S. presidential election. The historical volatility range and the broad-market U.S. index show a high inverse correlation. And this could work to investors' advantage. Shortly before the election, on October 29, a weak market phase begins for the VIX, which could last until December 25. During this period, volatility loses significant momentum, to the benefit of the U.S. stock market. In the past ten years, the S&P has been able to gain an average of more than 3% in 75% of cases.
Seasonality of the S&P 500 and VIX in the past nine election years

Risk Management is Key
In election years, volatility is highest compared to the other years of the U.S. election cycle. And especially shortly before and after the election, increased volatility in the stock market must be expected. Traders can use this knowledge by 1.) profiting from the inverse correlation between the VIX and the S&P. In this case, a short position could be opened on the VIX and a long position on the S&P. 2.) The trader hedges their existing portfolio. With short positions, investors could prepare for a surprise on election day. The best example of this was the 2016 election. To general surprise, Donald Trump emerged as the winner. The DAX, for example, was down more than 500 points in pre-market trading on this memorable day. At the end of the trading day, the German benchmark index closed up around 250 points.