Alphabet, Meta, Microsoft Technical Analysis Ahead of Earnings Release
Alphabet Inc. (GOOG), Meta Platforms Inc. (META), and Microsoft Corporation (MSFT) are set to release their quarterly earnings this week. These stocks shows positive price action ahead of the announcements. Google is scheduled to announce its Q3 2024 earnings on October 29, 2024, with expected GAAP EPS of $5.28 and revenue of $40.3 billion. Moreover, Meta expects a GAAP EPS of $5.28 and a revenue estimate of $40.3 billion in Q3 2024 earnings report on October 30, 2024. On the other hand, Microsoft expects a GAAP EPS of $3.11 and a revenue estimate of $64.56 billion during the upcoming earnings on October 30, 2024.
Over the past few years, these stocks have demonstrated significant growth in revenue and net income. Alphabet reported the highest revenue and net income in Q2 2024, as shown in the chart below. The revenue and net income reached $84.74 billion and $23.62 billion, respectively. Additionally, Google’s Q2 2024 revenue rose 14% year-over-year, with operating income increasing to $27.4 billion. The operating margin also improved to 32%.
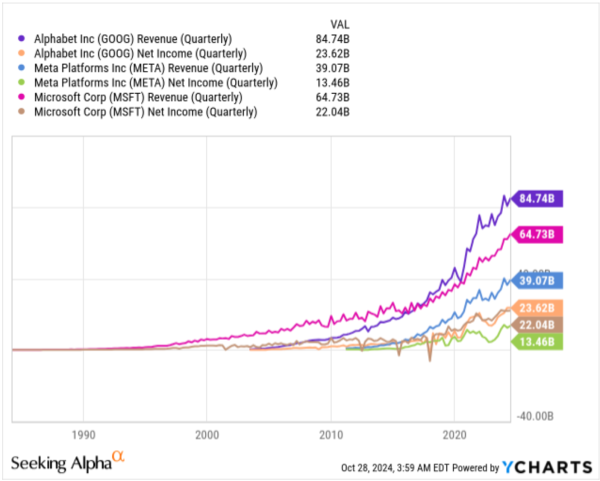
During the previous earnings report, Meta reported total revenue of $39.07 billion, marking a 22% year-over-year increase. Daily active people (DAP) across its Family of Apps reached 3.27 billion in June 2024, representing a 7% increase compared to the previous year. Meta’s costs and expenses rose by 7% year-over-year to $24.22 billion, while capital expenditures totaled $8.47 billion. The company also returned $6.32 billion to shareholders through share repurchases.
Meanwhile, Microsoft’s Q4 2024 revenue reached $64.7 billion, up 15% year-over-year, with operating income rising 15% to $27.9 billion. Net income increased by 10% to $22 billion, and diluted EPS rose by 10% to $2.69. Strong growth in segments like Intelligent Cloud, up 19%, and Dynamics products and services, up 16%, contributed to this.
Alphabet (GOOG) Technical Analysis
Alphabet Weekly Chart – Retest of Inverted Head and Shoulders
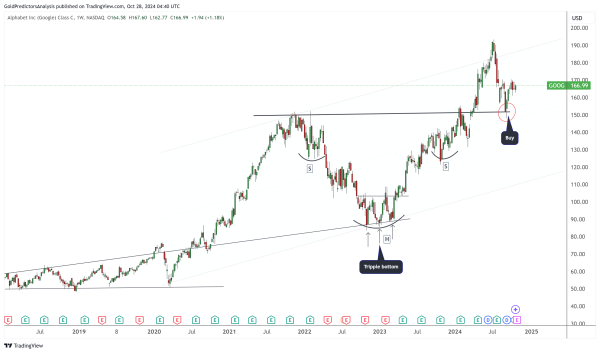
The weekly chart for Google reveals a solid bullish price action characterized by an inverted head-and-shoulders pattern. The head of this pattern formed in the first quarter of 2024, supported by a black trend line. This trend line extends from a wedge pattern established in 2018 and 2019. This head is also marked by the triple bottom on the weekly chart, indicating long-term support.
These historical bullish price patterns indicate a long-term bullish potential for Google. Recently, the price has been testing the neckline of the inverted head-and-shoulders pattern ahead of the Q3 2024 earnings release. The earnings release may induce significant volatility, which may push the prices higher.
Alphabet Daily Chart – Inverted Head and Shoulders
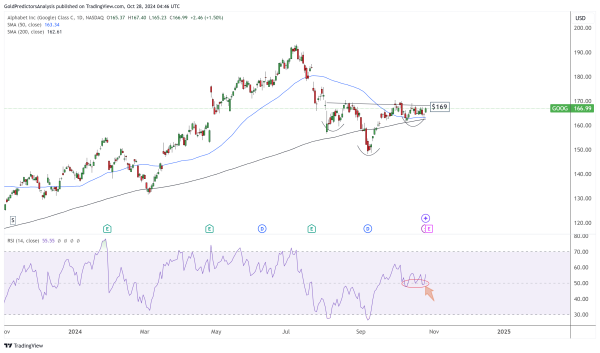
The daily chart shows the formation of an inverted head-and-shoulders pattern with the neckline at $169. If earnings exceed forecasts, Google may breach the neckline and begin climbing higher. The price is currently above the 50-day and 200-day SMAs, indicating positive momentum. Additionally, the RSI is holding at the mid-level, further supporting positive momentum for Google.
Meta Platforms (META) Technical Analysis
META Weekly Chart – Double Bottom within Symmetrical Broadening Wedge Pattern
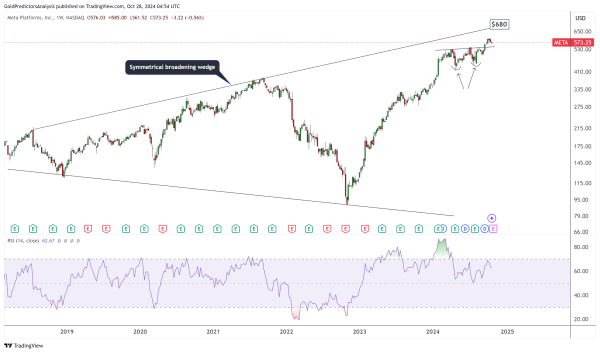
The weekly chart for Meta shows positive momentum with a double bottom formation within a symmetrical broadening wedge pattern. This broadening wedge pattern indicates strong price volatility. However, the double bottom formation suggests short-term bullish momentum. If prices continue higher, the target is around the $680 level, as indicated by the resistance line of the symmetrical broadening wedge pattern.
META Daily Chart – Ascending Channel
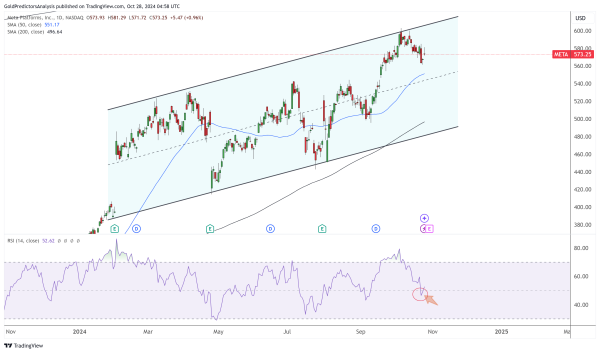
The daily chart for Meta also shows positive momentum within an ascending channel. The price is trading above the 50-day and 200-day SMAs, indicating strong price action. Additionally, the RSI bottoms around the mid-level, suggesting positive price action ahead of the earnings release.
Microsoft (MSFT) Technical Analysis
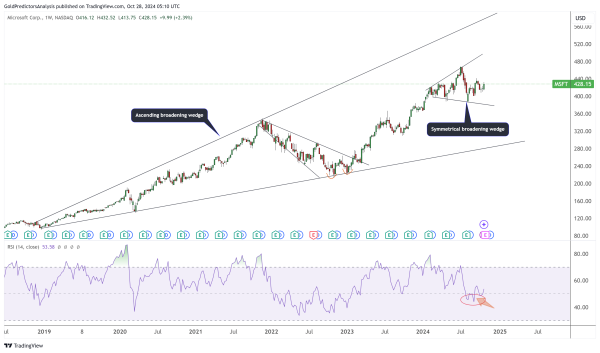
Microsoft Weekly Chart – Ascending Broadening Wedge Pattern
The weekly chart for Microsoft shows the formation of an ascending broadening wedge pattern extending from 2019. The price has been moving within this pattern for the past six years, indicating strong volatility. The emergence of a symmetrical broadening wedge within this pattern suggests a further increase in volatility. Additionally, the RSI is bottoming at the mid-level, indicating positive momentum in price.
Microsoft Daily Chart – Symmetrical Broadening Wedge Pattern
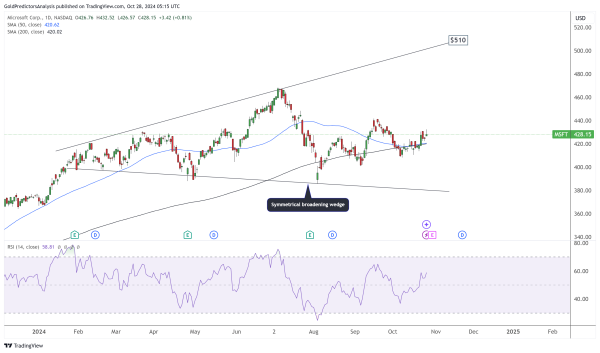
The symmetrical broadening wedge pattern is also visible on the daily chart. This pattern suggests that if the price begins to move upward, the target remains around the $510 level. The RSI is positioned above the mid-level, which indicates that the price could continue to increase.
Final Thoughts
In conclusion, Alphabet, Meta, and Microsoft show positive momentum ahead of earnings. Google’s patterns suggest bullish potential if results exceed forecasts. Meta’s double bottom and ascending channel indicates posotive momentum, while Microsoft’s wedge patterns indicate high volatility with upside potential. Recent strong financials further support a favorable outlook. The earnings release may result in strong price volatility. A price dip in these stocks after the earnings may be the good buying opportunity for investors.