AUD/USD Forex Signal: Double-Top Points to a Brief Pullback
Bearish view
- Sell the AUD/USD pair and set a take-profit at 0.6700.
- Add a take-profit at 0.6870.
- Timeline: 1-2 days.
Bullish view
- Buy the AUD/USD pair and set a take-profit at 0.6870.
- Add a stop-loss at 0.6700.
The AUD/USD exchange rate stalled at an important level as traders continued reflecting on Jerome Powell’s statement on Friday. It soared to a high of 0.6800 this week, its highest swing since July 11, which is about 7% above its lowest level this month.
The AUD/USD pair remained at an elevated level as the US dollar continued falling after the Fed chair hinted that interest rate cuts were coming.
What is still unclear, however, is the size of the cuts. The real number will depend on next week’s jobs report, which will provide more information about the state of the labor market. Another set of weak report will increase the probability of a jumbo interest rate cut in September.
Top Forex Brokers
1Before the NFP data, the market will react to other secondary numbers like Thursday’s GDP and initial jobless claims. The US will also publish the personal consumption expenditure (PCE) report on Friday, which will provide more information on inflation.
While the PCE is an important report, the Fed is now focused on the labor market, which has softened in the past few months. The last NP report showed that the economy added 114k jobs and the unemployment rate rose to 4.3%.
Meanwhile, in Australia, the central bank has signaled that it has more work to do to fight inflation. Last week’s minutes showed that officials even discussed hiking rates in the last meeting.
While the bank is not expected to hike rates, analysts expect that it will be the last major central bank to cut.
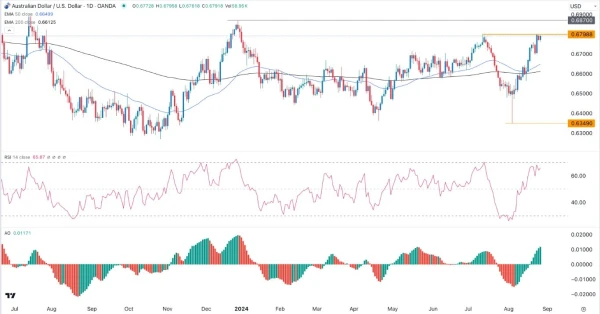
AUD/USD technical analysis
The AUD/USD exchange rate has made a strong comeback in the past few weeks. This rally happened after the pair formed a hammer pattern on August 5. In most cases, the hammer pattern is a highly popular bullish sign.
The pair has risen above the 50-day and 200-day moving averages, meaning that bulls are in control. Also, the Relative Strength Index (RSI) is approaching the overbought point. The Awesome Oscillator has remained above the neutral point in the past six consecutive days.
While the pair’s view is bullish, it has also formed a double-top chart pattern at 0.6800. A double-top often leads to a bearish breakout. Therefore, there is a risk that it will retreat in the coming days. If this happens, it will likely retest the key support at 0.6700.
Ready to trade our free trading signals? We’ve made a list of the top forex brokers in Australia for you to check out.