AUD/USD Forex Signal: Weekly Chart Points to More Gains Ahead
Bullish view
- Buy the AUD/USD pair and set a take-profit at 0.6800.
- Add a stop-loss at 0.6685.
- Timeline: 1-2 days.
Bearish view
- Set a sell-stop at 0.6735 and a take-profit at 0.6670.
- Add a stop-loss at 0.6800.
The AUD/USD exchange rate is in its third consecutive week of gains as the US dollar’s crash accelerates. It rose to a high of 0.6742, up by over 6% from its lowest point this month.
FOMC minutes ahead
The AUD/USD pair continued rising after the Reserve Bank of Australia (RBA) published minutes of the last meeting. These minutes showed that the bank’s officials deliberated about hiking interest rates because of the stubbornly high inflation.
The RBA’s view is different from that of the Federal Reserve, which left rates unchanged between 5.25% and 5.50% and left the door wide open for a September cut.
Top Forex Brokers
1Therefore, the AUD/USD pair has risen because of the ongoing divergence between the two central banks. Some analysts expect the RBA will start cutting rates either in the fourth quarter or in early 2025.
The next crucial catalyst for the AUD/USD pair will be the upcoming Federal Reserve minutes, which will provide more information about the last meeting. In the past, these minutes have had a big impact on the US dollar.
The most important news of the week will be Thursday’s US jobless claims data and the Jackson Hole Symposium.
AUD/USD weekly technical analysis
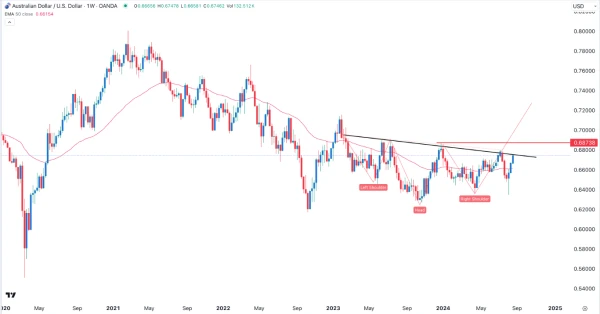
The weekly chart shows that the AUD/USD pair formed a hammer pattern earlier this week, resulting in the ongoing recovery. A hammer is characterized by a small body and a long lower shadow and is often a highly bullish candlestick.
It has also formed an inverse head and shoulders pattern and has now moved to its neckline. The pair has also moved above the 50-week moving average. Therefore, the outlook is bullish, with the next resistance point to watch being at 0.6875, its highest point in December last year.
AUD/USD 4H chart analysis
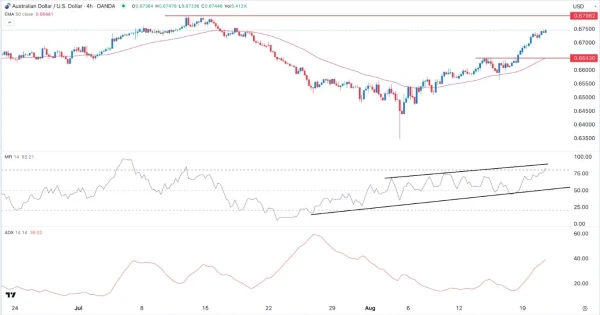
The 4H chart shows that the AUD/USD pair has been in a strong bullish momentum in the past few weeks. It recently crossed the important resistance point at 0.6645, its highest swing on August 14. By moving above that level, the pair invalidated a small double-top pattern that was forming.
The Relative Strength Index (RSI) has formed an ascending channel and moved to the overbought level. Also, the Average Directional Index (ADX) has moved to 39, its highest level since July 31.
Therefore, the uptrend will likely continue, with the next reference level to watch being at 0.6800, its highest swing in July.
Ready to trade our free trading signals? We’ve made a list of the top forex brokers in Australia for you to check out.