Australian Dollar Forecast: Will AUD/USD Break $0.68? The Fed and China Data in Focus
Chinese Economy Falters
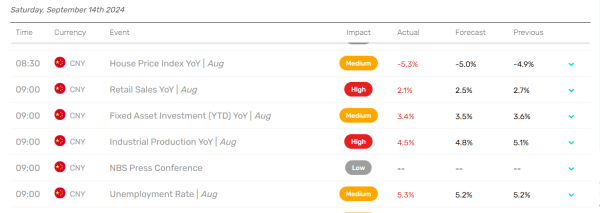
On Saturday, September 14, economic data from China drew interest and could influence the AUD/USD pair.
House prices trended lower in August, while industrial production increased at a slower pace year-on-year. Domestic demand conditions also waned, evidenced by lower retail sales and rising unemployment.
Commodities, Exports, and the Aussie Economy
The deteriorating Chinese economy signals softer demand for key Aussie exports such as coal and iron, painting a gloomy outlook for Australia’s economy. Notably, Chinese factories have started reselling commodities at lower prices, particularly affecting iron ore prices. As one of Australia’s main exports, lower iron ore prices may worsen Australian trade terms.
Australia has a trade-to-GDP ratio of over 50%, with 20% of its workforce in trade-related jobs. Furthermore, China accounts for one-third of Australia’s exports. Weaker demand from China and lower commodity prices could adversely impact the Aussie dollar, possibly pulling the AUD/USD pair down toward $0.66500.
Expert Views on Commodity Prices and the RBA Rate Path
AMP Head of Investment Strategy and Chief Economist Shane Oliver recently remarked on the RBA rate path, stating,
“The resumption of share mkt weakness along with falling commodity prices & bond ylds is signalling concerns about the global economy the RBA can’t ignore.Just as the Fed has changed its tune significantly over the last few mths there is a high probability the RBA will do the same so the Australian money market’s continued pricing in of a rate cut by year end – a 0.25% rate cut is priced in with a 92% probability – may not be that outlandish, despite recent RBA guidance.”
The US Economic Calendar: Manufacturing in Focus
On Monday, September 16, the spotlight will be on the US manufacturing sector. Economists expect the NY Empire State Manufacturing Index to fall by 3.9% in September after a 4.7% drop in August.
Weaker-than-expected numbers may reinforce expectations of a 50-basis point September Fed rate cut. Despite accounting for less than 20% of the US economy, weakening sector activity may impact labor market conditions, as it accounts for around 9% of the US workforce.
Short-Term Forecast for AUD/USD
Near-term AUD/USD trends will likely hinge on Wednesday’s Fed interest rate decision and Aussie labor market data on Thursday. A 50-basis point Fed rate cut and steady Aussie unemployment rate could push the AUD/USD toward $0.68. However, a faltering Chinese economy may raise the bets on a Q4 25-basis point RBA rate cut, possibly preventing a move toward $0.70.
Investors should monitor key economic data and central bank communications closely, which may impact AUD/USD trends. Monitor the real-time data, news updates, and expert commentary to adjust your trading strategies.
AUD/USD Technical Analysis
Daily Chart
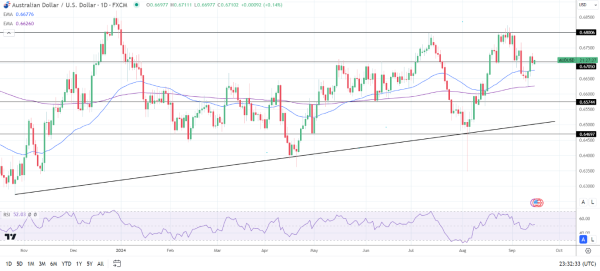
The AUD/USD remains above the 50-day and 200-day EMAs, sending bullish price signals.
A return to the $0.67500 level could support a move toward the September 6 high of $0.67672. Furthermore, a breakout from $0.67672 may give the bulls a run at the $0.68006 resistance level.
Commodity price trends, central bank commentary, and the US economic calendar require consideration.
Conversely, a drop below the $0.67050 support level may signal a fall toward the 50-day EMA. A break below the 50-day EMA could give the bears a run at the $0.66500 level.
With a 14-period Daily RSI reading of 52.03, the Aussie dollar could move to the $0.68006 resistance level before entering overbought territory.