Bitcoin (BTC) News Today: Analyzing BTC-Spot ETF Flows Amid US Economic Reports
BTC-Spot ETF Market Flow Data Send Bearish Signals
Bitcoin (BTC) advanced by 0.36% on Thursday (April 25). Partially reversing a 3.25% loss from Wednesday (April 24), BTC ended the session at $64,564.
BTC-spot ETF market flow data pressured BTC through the Thursday morning session. On Wednesday (April 24), the BTC-spot ETF market saw total net outflows of $120.6 million.
According to Farside Investors,
- GBTC saw net outflows of $130.4 million, up from $66.9 million on Tuesday (April 23).
- Fidelity Wise Origin Bitcoin Fund (FBTC) saw net inflows of $5.6 million, up from $4.4 million (April 23).
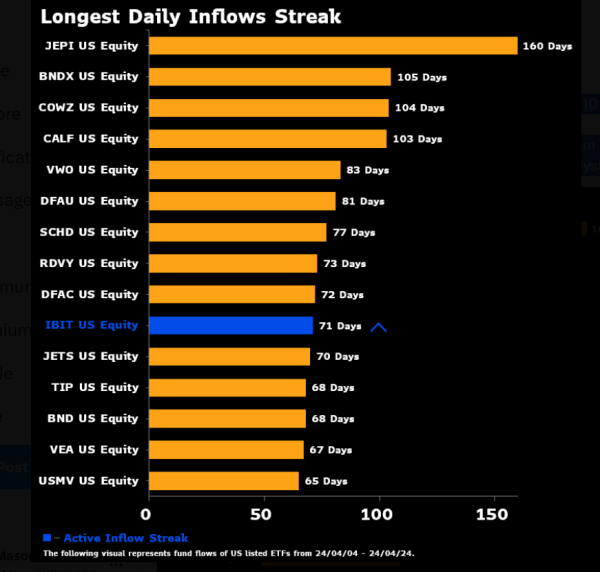
- iShares Bitcoin Trust (IBIT) saw zero net flows on Wednesday (April 24). Significantly, IBIT saw its 71-day net inflows streak end, ranking IBIT tenth on the daily inflows streak table.
BTC reacted to the BTC-spot ETF flow data, falling to a Thursday (April 25) session low of $62,844.
However, US economic indicators from Thursday (April 25) drove buyer demand for BTC in the afternoon session. The US economy expanded by 3.1% in Q1 2024 after growing by 3.4% in Q4 2023. Weaker growth raised hopes of a 2024 Fed rate cut.
Nevertheless, BTC-spot ETF market flow data for Thursday (April 25) impacted buyer demand going into the Friday (April 26) session.
According to preliminary Thursday (April 25) numbers from Farside Investors:
- Grayscale BTC Trust saw net outflows increase from $130.4 million (April 24) to $139.4 million (April 25).
- Fidelity Wise Origin Bitcoin Fund (FBTC) saw net outflows of $22.6 million (April 25). FBTC registered net outflows for the first time since launching on January 11.
- ARK 21Shares Bitcoin ETF (ARKB) saw net outflows of $31.3 million (April 25).
- Valkyrie Bitcoin Fund (BRRR) saw net outflows of $20.2 million (April 25).
- Excluding flow data for iShares Bitcoin Trust (IBIT), the BTC-spot ETF market saw net outflows of $217.6 million.
Investor anxiety over the US Personal Income and Expenditures Report (Fri) likely influenced BTC-ETF flow data.
Upward personal income/spending trends and hotter-than-expected US inflation numbers could sink bets on multiple 2024 Fed rate cuts.
Technical Analysis
Bitcoin Analysis
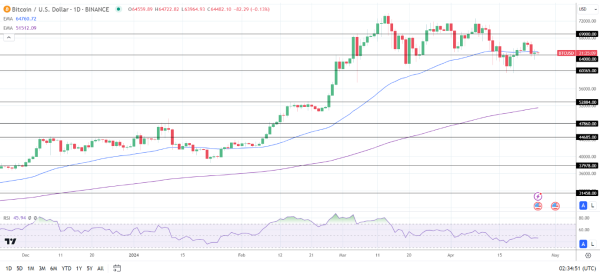
BTC hovered below the 50-day EMA while remaining above the 200-day EMA. The EMAs affirmed the bearish near-term but bullish longer-term price signals.
A BTC breakout from the 50-day EMA would give the bulls a run at the $69,000 resistance level. A BTC break above the $69,000 resistance level would support a move to the $70,000 handle.
On Friday, the US Personal Income and Expenditures Report and BTC-spot ETF flow data need consideration.
Conversely, a BTC fall through the $64,000 support level would bring the $60,365 support level into play.
With a 14-Daily RSI reading of 45.94, BTC may drop to the $60,365 support level before entering oversold territory.
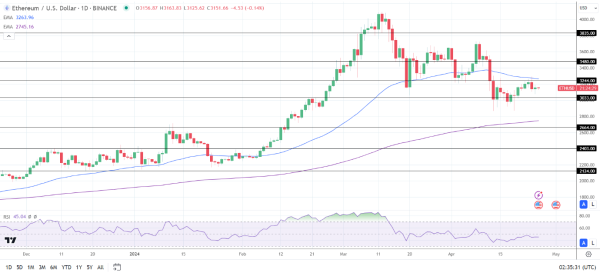
Ethereum Analysis
ETH remained below the 50-day EMA while holding above the 200-day EMA. The EMAs confirmed the bearish near-term but bullish longer-term price trends.
An ETH break above the $3,244 resistance level would support a move to the 50-day EMA. A move through the 50-day EMA would give the bulls a run at the $3,480 resistance level.
Conversely, an ETH fall through the $3,100 handle would bring the $3,033 support level into play.
The 14-period Daily RSI reading of 45.04 indicates an ETH drop below the $3,033 support level before entering oversold territory.