Bitcoin (BTC) News Today: Bullish Momentum Toward $70,000 Continues After Halving
BTC-Spot ETF Market Flow Trends and the Bitcoin Halving
BTC gained 1.94% on Saturday (April 20). After advancing by 0.54% on Friday (April 19), BTC ended the session at $65,920.
Investors responded positively to the Bitcoin Halving. On Saturday morning (UTC), the Bitcoin Halving occurred at block height 840,000. The block subsidy fell to 3.125 BTC.
BTC-spot ETF market flow trends reflected investor sentiment toward the Bitcoin Halving. The BTC-spot ETF market ended a run of five successive sessions of net outflows. On Friday (April 19), the BTC-spot ETF market saw total net inflows of $59.7 million. iShares Bitcoin Trust (IBIT) registered 69 consecutive sessions of net inflows.
However, the BTC-spot ETF market saw total net outflows of $204.3 million in the week ending April 19.
After the Bitcoin Halving, the focus will likely turn to the demand side of the supply-demand equation. An uptrend in BTC-spot ETF market inflows could drive buyer demand for BTC.
Ripple (XRP) CEO Brad Garlinghouse and MicroStrategy (MSTR) founder and Chairman Michael Saylor have optimistic outlooks.
On Thursday, Garlinghouse discussed the influence of the BTC-spot ETF market and the Halving on the supply-demand outlook. Significantly, Garlinghouse viewed his previous prediction of a $5 trillion crypto market as too conservative.
In the lead-up to the Bitcoin Halving, Michael Saylor also discussed the impact of the BTC-spot ETF market and the Halving on the supply-demand dynamic. On Saturday, Michael Saylor referred to the Bitcoin Halving, saying,
“BTC was $8,618 on the day of the last Bitcoin Halving.”
Market conditions improved going into the Saturday session. Investors responded to news of Iran downplaying the reported Israeli retaliation against the Iran attack on Saturday, April 13. Easing investor fears of a more widespread Middle East conflict contributed to the gains on Saturday (April 20).
Technical Analysis
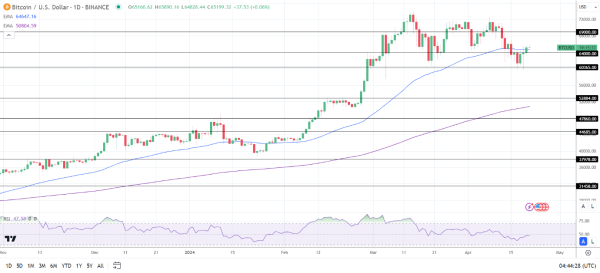
Bitcoin Analysis
BTC sat above the 50-day and 200-day EMAs, sending bullish price signals.
A BTC return to the $67,500 handle would support a move to the $69,000 resistance level.
On Sunday, BTC-spot ETF market-related chatter needs investor consideration.
Conversely, a BTC break below the 50-day EMA and the $64,000 support level could give the bears a run at the $60,365 support level.
With a 14-Daily RSI reading of 47.58, BTC may drop below the $60,000 handle before entering oversold territory.
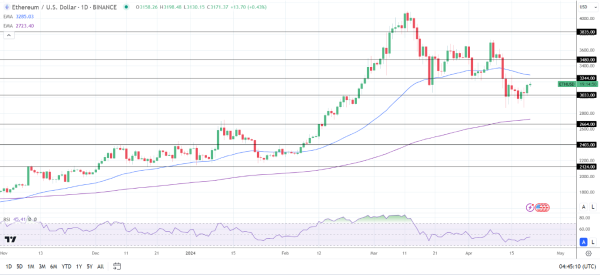
Ethereum Analysis
ETH hovered below the 50-day EMA while remaining above the 200-day EMA. The EMAs confirmed the bearish near-term but bullish longer-term price trends.
An ETH move through the $3,244 resistance level would bring the 50-day EMA into play. A break above the 50-day EMA could give the bulls a run at the $3,480 resistance level.
Conversely, an ETH fall through the $3,033 support level could signal a drop to the $2,800 handle.
The 14-period Daily RSI reading of 45.41 suggests an ETH drop to the $2,800 handle before entering oversold territory.