Bitcoin (BTC) Price Analysis: Tesla Wallet Moves Unphazed as ETF Inflows Surge
BTC Holds onto $68,000 on Demand Trends
On Saturday, October 19, BTC declined by 0.17%, partially reversing a 1.63% gain from the previous session, closing at $68,279. Despite the pullback, BTC held onto the $68,000 handle for the second consecutive session.
BTC Demand Stays Strong as US BTC-Spot ETF Inflows Surge
This week, the US BTC-spot ETF market highlighted a renewed interest. Total net inflows surged by $2,130 billion in the week ending October 18, the highest since Q1 2024.
US BTC-spot inflows surged on investor expectations of November and December Fed rate cuts. Additionally, signs of a US soft-economic landing increased demand for riskier assets, including spot ETFs.
BTC Unmoved by Tesla’s Transfer of $760 Million in BTC to New Wallets
Notably, US BTC-spot ETF inflows overshadowed the news of Tesla (TSLA) moving $760 million equivalent in BTC to new wallets. Arkham Intelligence reported the transfer on October 16. However, Tesla’s BTC holdings remained unchanged, indicating that Tesla owned the new wallets.
According to Arkham Intelligence, Tesla currently holds 11,509 BTC, equivalent to $785.05 million. Significantly, there were no hints about an imminent BTC sale. Nevertheless, the activity could keep investors on edge until Tesla releases its quarterly earnings report on October 23.
US Presidential Election and BTC Demand
Bitcoin supply-demand trends will continue to influence the appetite for BTC. However, the US Presidential Election could have a significant impact. Donald Trump has proposed to add BTC to the US strategic reserves. A shift in the US government’s stance could tilt the supply-demand balance firmly in BTC’s favor.
The US government currently holds 203,239 BTC, which could increase substantially if the US adds BTC to its strategic reserves. Significantly, a Trump win could end the threat of sizeable US government sales of BTC seized from the Silk Road.
Increased demand from the US BTC-spot ETF market and a US government that buys and HODLs BTC could refuel bets on a BTC move toward $100,000.
Trump vs. Harris: Betting Odds vs. Polls
The betting platform Polymarket gives Trump a 59.7% chance of winning the election. Recently, Polymarket hit the news after reports of BTC whales skewing the odds. Meanwhile, FiveThirtyEight‘s polls show Vice President Kamala Harris leading Trump, with Harris at 48.4% compared to Trump’s 46.3%.
Elon Musk recently remarked on Polymarket’s odds, stating,
“Trump now leading Kamala by 3% in betting markets. More accurate than polls, as actual money is on the line.”
Outlook: Keep a Close Eye on Election and ETF Trends
Investors should remain alert as the US Presidential Election nears. Betting odds, the polls, and US BTC-spot ETF market flows could affect BTC price trends. Stay updated with our real-time BTC analysis for further insights on managing potential risks.
Technical Analysis
Bitcoin Analysis
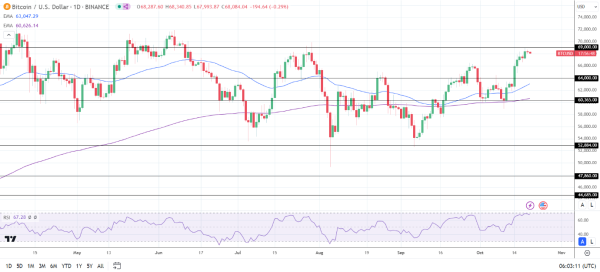
BTC sits comfortably above the 50-day and 200-day EMAs, affirming bullish price signals.
A break above the $69,000 resistance level could support a return to $70,000. Furthermore, a breakout from $70,000 may allow the bulls to target BTC’s all-time high of $73,808.
Investors should consider sentiment toward the Fed rate path, the US Presidential Election, and US BTC-spot ETF market flow trends.
Conversely, a break below $67,500 could suggest a drop toward $65,000. A fall through $65,000 would bring the $64,000 support level into play.
With a 68.47 14-day RSI reading, BTC could break above the $69,000 resistance level before entering overbought territory.

Ethereum Analysis
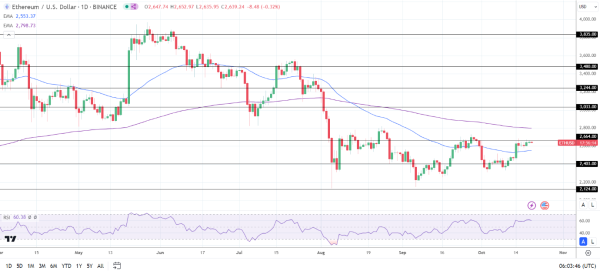
ETH hovers above the 50-day EMA while remaining below the 200-day EMA, sending bullish near-term but bearish price longer-term price signals.
An ETH breakout from the $2,664 resistance level could support a move toward the 200-day EMA. Furthermore, a break above the 200-day EMA may bring $3,000 into play.
US ETH-spot ETF market-related updates also require consideration.
Conversely, an ETH drop below the 50-day EMA could allow the bears to test the $2,403 support level.
The 14-period Daily RSI reading, 60.38, indicates an ETH break above the 200-day EMA before entering oversold territory.
