Bitcoin (BTC/USD) Eyes a Breakout, Have the Stars Finally Aligned?
- Bitcoin’s price surged to levels not seen since July, fueled by positive inflows and optimism around a potential bullish breakout.
- Despite ETF inflows, actual demand for Bitcoin has been waning since March, according to Glassnode data.
- Technical analysis shows Bitcoin facing resistance at various levels, with support levels identified in case of a price decline.
- Robert Kiyosaki, a known Bitcoin enthusiast, predicts a market crash and a potential drop in Bitcoin’s price to $5,000.
Most Read: S&P 500, Nasdaq 100 – Wall Street Indexes Eye Further Gains as Earnings Filter Through
Bitcoin prices surged today to levels last seen in July after closing above a key resistance level yesterday. An overnight pullback nearly touched the psychological 65,000 mark, but a renewed rally is now eyeing a push towards the 70,000 level.
The rally comes following a week of positive inflows which many analysts believe may be down to the upcoming US elections. I do think that a potential Republican clean sweep could be a contributing factor but not a major one at this stage.
Spot Bitcoin ETF flows enjoyed an excellent week ending October 11, before a blockbuster Monday which resulted in its biggest daily inflow since June. The 11 ETFs saw aggregate net inflows of $555.9 million.ETF Store President Nate Geraci described it as a “huge day” for spot BTC ETFs, noting that they are nearing $20 billion in net inflows over the last 10 months.
In an October 15 post on X, he remarked, “This is absolutely astounding and surpasses all pre-launch demand predictions. This is not ‘reckless retail’; it’s financial advisers and institutional investors gradually embracing the trend.”
Daily Bitcoin ETF inflows (green) on Oct. 14 were the highest since June.

Source: CoinGlass, Cointelegraph
Optimism continues to grow that the world’s largest cryptocurrency is ready for a bullish breakout. However, we have been here before over the past few months only to be left disappointed. Have the stars finally aligned?
Downside Risks – Profit Taking and Waning Demand
Despite the inflows into ETF, actual demand has been waning since March this year according to data from Glassnode. Looking at the demand side assessment by Glassnode, we can use the Binary CDD metric as another proxy for demand-side pressure. This metric tracks the expenditure of ‘holding time’ in the market, tracking when holders of old supply transact large volumes (balanced by new buyers entering).
We can now see a relatively light volume of coinday destruction, suggesting that long-term investors remain relatively inactive within the current price range.
Looking at the Glassnode gauges for demand-side intensity, it suggests investor attention and new demand inflows within this range are relatively muted and have not seen a significant second wave of YTD.
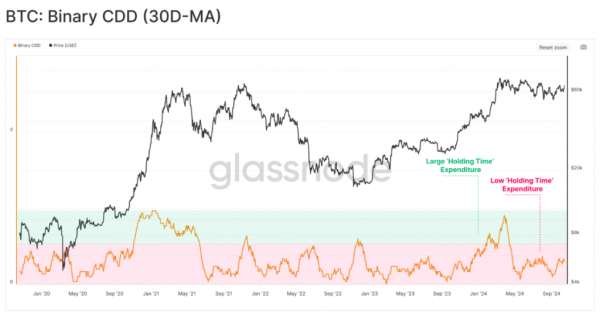
Source: Glassnode
The lack of demand around these price levels should concern Bitcoin bulls as the current levels have proved difficult to overcome.
In another surprise and concern for bulls if you will, famed crypto enthusiast Robert Kiyosaki who has continuously touted Bitcoin, Gold and Silver over normal investment made a surprising call. Now just to clarify, Kiyosaki has a tendency to make outrageous claims.
Mr Kiyosaki has once again claimed that a massive financial market crash is coming akin to the 2008 crisis. He suggested that Bitcoin could drop as low as 5000 yet he says this is an opportunity for astute investors.
Will Mr Kiyosaki be right this time or will the Bitcoin bulls finally take charge?
Technical Analysis BTC/USD
Bitcoin is currently trading around 0.77% up on the day having hit a high of around 67900 before a pullback toward support to trade at 65876 at the time of writing.
There are a host of technical hurdles that lie ahead and this is the source of my apprehension regarding an imminent breakout. Today’s daily candle already has faced some resistance by the inner trendline and resistance which rests at 68334. Just above this level we have the outer trendline which rests just shy of the 70000 psychological level. In short there are a host of hurdles making the entire range between 65800 and 70000 an area of confluence.
Given the downside risks present, let’s take a look at the potential support handles on the downside. Immediate support is at the psychological 65000 handle before the support handle at 63800 comes into focus with the 200-day MA resting just below at 63341. A break below this would open up a return toward the 60000 handle where the 50 and 100-day MA rest just above at 60848 and 61378 respectively.
Bitcoin (BTC/USD) Daily Chart, October 15, 2024
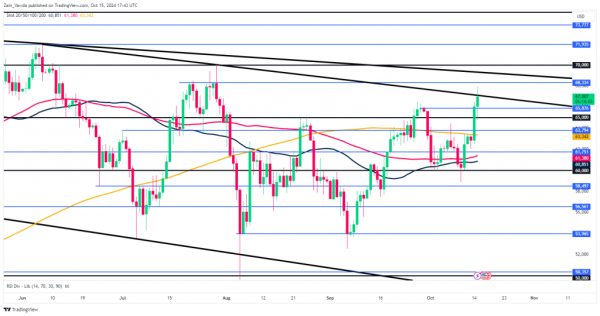
Source: TradingView.com (click to enlarge)
Support
- 65000
- 63341
- 61378
Resistance
- 68334
- 70000
- 71935
Follow Zain on Twitter/X for Additional Market News and Insights @zvawda
Content is for general information purposes only. It is not investment advice or a solution to buy or sell securities. Opinions are the authors; not necessarily that of OANDA Business Information & Services, Inc. or any of its affiliates, subsidiaries, officers or directors. If you would like to reproduce or redistribute any of the content found on MarketPulse, an award winning forex, commodities and global indices analysis and news site service produced by OANDA Business Information & Services, Inc., please access the RSS feed or contact us at [email protected]. Visit https://www.marketpulse.com/ to find out more about the beat of the global markets. © 2023 OANDA Business Information & Services Inc.