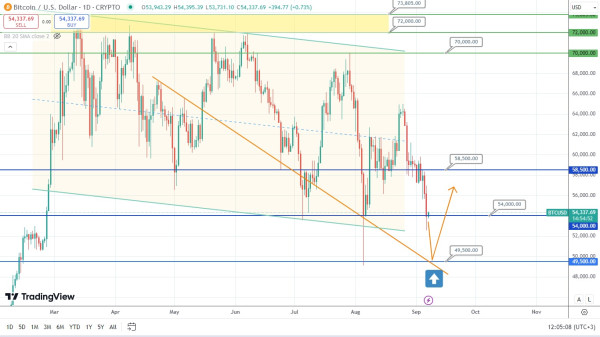
Bitcoin Forecast: Potential Price Correction Ahead
The price of Bitcoin is heading down and approaching the supporting level of 49500. It is also important that the broken downtrend is located next to this support. The price of this asset might gain the required support and rise. So, let’s observe what is going to be the next price movement of this asset.
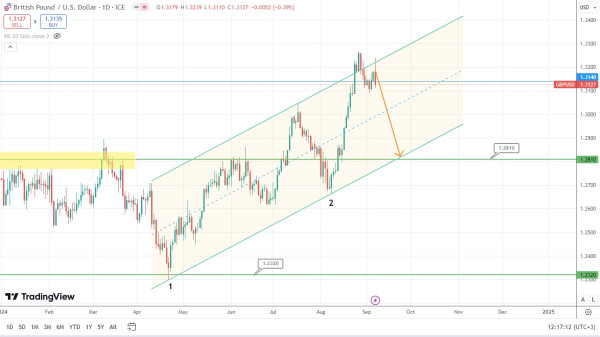
Last week the price of the British pound was on the rise. However, it rebounded from the uptrend and dropped at the end of the trading week. Now, the asset’s price is testing the broken trendline, leaving a long spike behind. It looks like the price of the British pound might undergo a correction and drop at the beginning of the next trading week. Time will tell whether this scenario might work out.
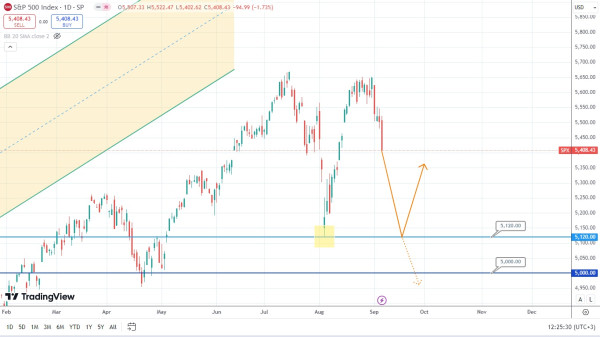
The price of the American stock index S&P500 is heading down. However, it might gain the required support at the very strong level of 5120. At this point, two scenarios are possible. The price of this asset might rebound from the supporting level and rise. On the other hand, it might break the supporting level and undergo even deeper correction. In this case, it would be very important to follow the price movements of the stock index around the support to forecast the upcoming market sentiment.