Bitcoin Forecast: Potential Price Drop Ahead
Currently, the price of Bitcoin is undergoing a correction and testing the psychological level of 60000. Should the price of this asset break the level through, it might either test the supporting level of 49000 or target the level of 40000. Also, the potential breakout of the level of 60000 would complete the formation of such a reversal pattern as a double top. So, let’s observe what might happen next.

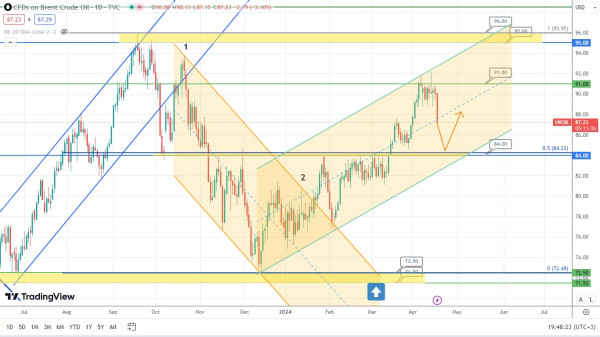
The price of Brent oil rebounded from the level of 91.00 and dropped. It is likely to target a very strong and important supporting level of 84.00, which has already been approached many times in a row and rebounded from. Hence, the price of this asset is likely to rebound from this level yet again.

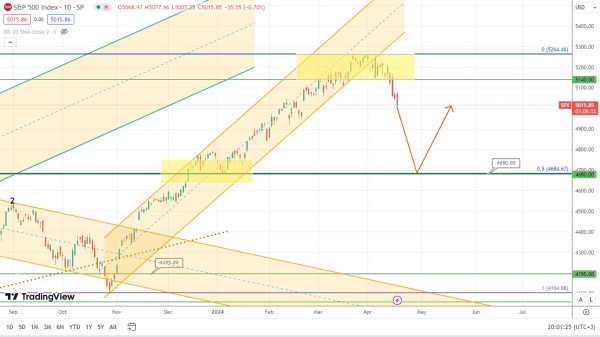
The price of the American stock index S&P500 has reached the maximum point and dropped. It might eventually gain the required support at the level of 4680, which also acts as a 50% Fibonacci retracement from the latest ascending move. It looks like the price of this index might potentially rebound from this level. Time will tell what is going to be the next price movement of this asset.

The most recent market reviews can be found at www.tickmill.com/blog
Follow us on X to catch up on recent news, trading ideas, and much more: www.twitter.com/Tickmill