Bitcoin Forecast: Potential Price Drop Ahead
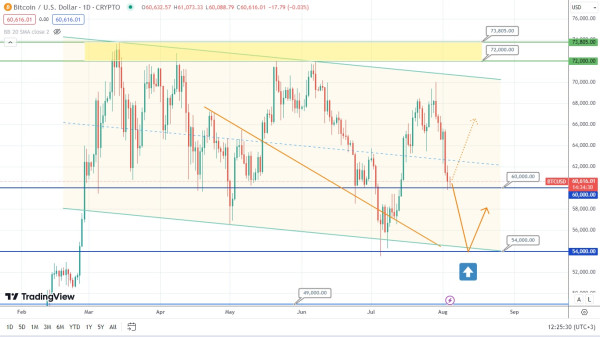
Last week, the price of Bitcoin kept going down, but it finally acquired the required support at the level of 60000. However, it seems that the price of this asset might potentially dive even deeper and gain the next support only at the level of 54000. After that, it is likely to rebound and rise. At this point, it would be important to follow the candlestick formations next to these levels to forecast the upcoming sentiment.
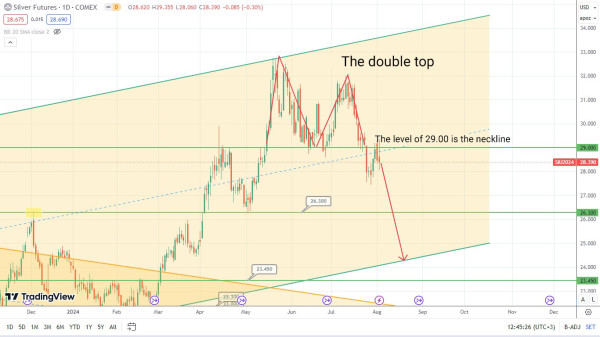
The daily chart of silver shows the reversal pattern, such as double top or rather its modified version, that is, the failed swing. Last week, the price of silver tested the broken neckline, that is, the level of 29.00, and dropped. Should the price of this asset dive even further, it might eventually hit the supporting level of 25.00. So, let’s observe what the next price movement of this asset might be.
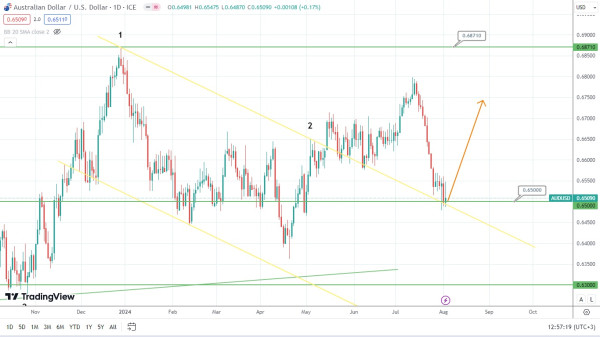
The price of Australian currency is currently testing the broken downtrend and the level of 0.6500. Hence, the price of the currency pair AUD/USD might rise and test the broken downtrend at the beginning of the trading week. Time will tell whether this scenario is going to work out.