Bitcoin Price Forecast: Potential Correction Ahead
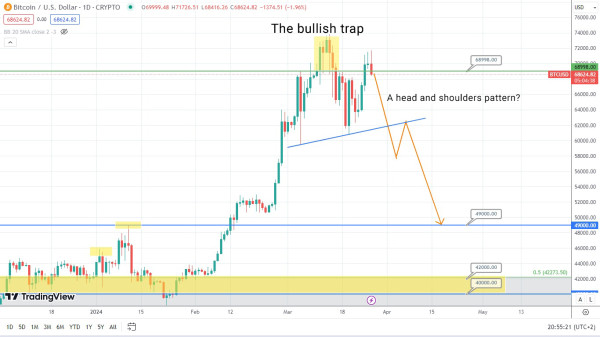
The price of Bitcoin has formed a false breakout at the level of 68998, confirming the bullish trap. This means that the price of the asset is likely to undergo a correction soon. So, let’s observe whether it is going to happen.
Currently, the asset’s price is trying to remain above the abovementioned level, signifying the potential formation of the head and shoulders pattern. This pattern is a sign of an upcoming trend reversal. In this case, the price of Bitcoin might potentially drop and acquire the required support at the level of 49000. This is just a matter of time. Hence, it would be wise to follow the breakout of the neckline. However, it is also important to keep the chance of a potential correction in mind, as investors are very confident about the future price rise. So, it looks like Bitcoin might jump soon.
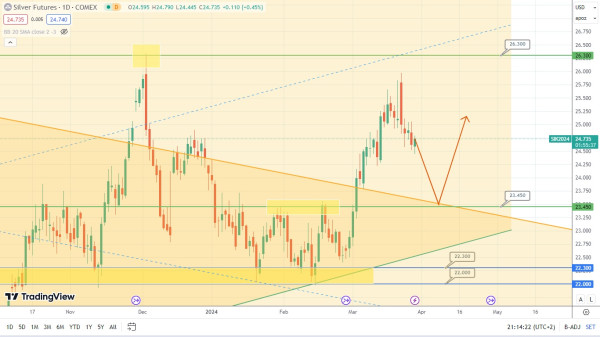
The price of silver did not manage to hit the resistance level of 26.30. Instead, the price of the asset has reversed and dropped. Silver might gain the required support at the level of 23.45, rise, and reach the maximum price points. Time will tell whether this scenario might work out.
The price of the Japanese yen is testing very important resistance at the level of 151.94, forming the Doji candles under this level. So, it looks like the price of this asset might rebound and target the supporting level of 146, although it may potentially form a flag. However, the price of the Japanese yen can only rise after a breakout of the level of 151.94, and this is not happening right now. So, let’s observe what the next price movement might be.
