Brent: Slumps on easing Middle East fears
- Brent ↓ 6% this week
- Fundamentals swing in favour of bears
- Watch out for US/China data and EIA report
- Technical levels: $77.90, $75 & $70.80
Oil benchmarks have been hammered this week, shedding over 6% thanks to potent fundamental forces.
- The global commodity stumbled into Monday’s session after China’s highly anticipated Finance Ministry briefing failed to impress investors.
- OPEC’s monthly oil market report rubbed salt into the wound as the cartel cut its demand forecast this year for the third time in a row.
- But the knockout blow for oil was delivered on Tuesday morning following reports that Israel may avoid striking Iran’s crude infrastructure.
With this development easing concerns over wider conflict and major supply disruptions, oil was left under the mercy of bears this week:
- WTI: -6.6%
- Brent: - 6.1%
Despite these heavy losses, oil prices are still up month-to-date and may see more volatility this week due to ongoing developments in China and US rate expectations.
This brings our attention to key US and China data scheduled near the end of the week.
- Thursday, October 17th: US retail sales, initial jobless claims, EIA data
- Friday, October 18th: China GDP, retail sales, industrial production, home prices
Over the past few weeks, confidence has improved in the US economic outlook thanks to better-than-expected data. If this translates to improving oil demand, the global commodity could receive a boost.
Still, US crude inventories have been rising over the past two weeks raising questions about demand. The latest EIA data on Thursday has the potential to move oil prices.
But it’s all about the data dump from China on Friday which could provide fresh insight into the health of the world’s largest energy consumers. Ultimately, a strong set of figures from China may boost optimism over the demand outlook – supporting oil prices as a result.
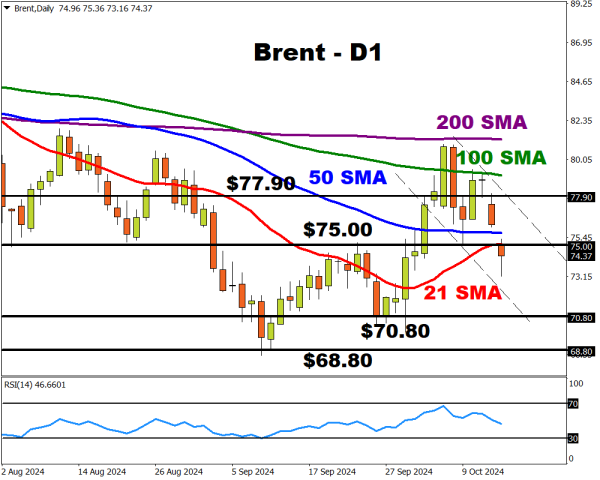
Looking at the technicals…
Prices are under intense pressure on the daily charts with Brent respecting a bearish channel.
There have been consistently lower lows and lower highs while the MACD trades to the downside. However, daily support can be seen around the $73.00 level.
- A solid breakdown and daily close below $73.00 could send prices back toward $70.80 and $68.80.
- Should $73.00 prove reliable support, this could trigger a rebound toward the 21-day SMA at $75.00 and $77.90.