BTC/USD Forex Signal: Bitcoin Finds Strong Resistance at $64,960
Bullish View
- Set a buy-stop at 64,960 and a take-profit at 68,000.
- Add a stop-loss at 60,000.
- Timeline: 1-2 days.
Bearish View
- Set a sell-stop at 62,784 and a take-profit at 60,000.
- Add a stop-loss at 66,000.
Bitcoin price retreated slightly in the overnight session as it found a strong resistance point at $64,960. The BTC/USD pair was trading at 63,390, which is almost 30% above its lowest point this month.
Bitcoin’s price action mirrored that of American stocks. The Nasdaq 100 index dropped by 143 points while the S&P 500 index fell by 17 points. The Dow Jones rose to a record high of $41,200.
Bitcoin’s price also retreated as the US dollar index (DXY) rose slightly to $100.7. It rose slightly as some investors attempted to buy the dip after falling by over 6% from its highest point this year.
Bitcoin has remained in a tight range in the last few weeks as Exchange Traded Funds (ETF) inflows continued. Data by SoSoValue shows that daily inflows rose in the past seven consecutive days.
Most of these gains came on Friday after the Federal Reserve pointed to potential cuts in September. Altogether, these funds have brought in over $17.8 billion in inflows this year.
Analysts expect that Bitcoin and other risky assets will have more robust inflows as the Fed starts slashing rates.
Meanwhile, Bitcoin’s performance happened as the number of active addresses on the chain dropped to 500k, its lowest point since June while the number of transactions in the network pulled back.
Top Forex Brokers
1BTC/USD Technical Analysis
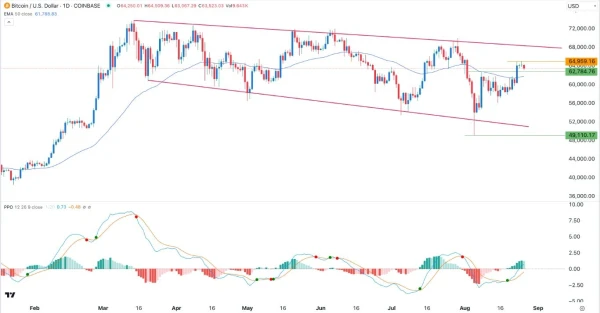
On the daily chart, we see that the BTC/USD pair bottomed at 49,110 this month. It then formed a hammer pattern, a popular bullish sign. For most of the past two weeks, it has remained below the key resistance point at 62,785. It also oscillated between 62,785 and the support at 58,000.
Bitcoin then made a bullish breakout after Jerome Powell pointed to upcoming Federal Reserve cuts. However, the pair found a strong resistance point at 64,960, where it failed to move during the weekend.
On the positive side, the pair has remained above the 50-day Exponential Moving Average (EMA). Also, the Percentage Price Oscillator (PPO) indicator has moved above the neutral point.
Therefore, the pair will likely have a bullish breakout as buyers target the key resistance point at 68,000. This view will be confirmed if the price moves above the key resistance point at 64,960. On the flip side, a drop below the support at 62,784 will invalidate the bullish view.
Ready to trade our free daily Forex trading signals? We’ve shortlisted the best MT4 crypto brokers in the industry for you.