BTC/USD Forex Signal: On the Cusp of a Bearish Breakdown
Bearish view
- Sell the BTC/USD pair and set a take-profit at 54,000.
- Add a stop-loss at 61,000.
- Timeline: 1-2 days.
Bullish view
- Set a buy-stop at 60,000 and a take-profit at 61,000.
- Add a stop-loss at 54,000.
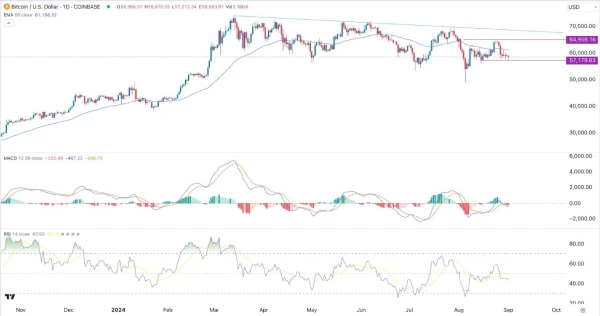
Bitcoin has come under pressure in the past few weeks as it continued to underperform key assets like stocks. The BTC/USD pair retreated to a low of 57,180 on Monday, down from last week’s high of 64,960.
Bitcoin’s retreat has coincided with the weak performance of spot ETFs. Data shows that spot ETFs have lost assets in the last four consecutive days. In all, they have lost over $300 million in the last four days. This means that these funds have added over $17.6 billion in assets this year, with the biggest ones being by Blackrock, Fidelity, and Ark Invest.
Bitcoin has also dropped as odds that Kamala Harris will win the next general election rose. Recent polling data shows that Trump is either tied with Harris or a few points below in key swing states. He is also a few points below her in a Polymarket poll.
Top Forex Brokers
1Trump has been seen widely as the best president for the crypto industry because of his commitment that the US would become the hub of crypto innovation if he wins.
Meanwhile, the crypto industry is still going through liquidity issues as the amount of coins in reserves retreat. Also, there are fears that governments like the UK, Ukraine, and the United States will start selling coins in their holdings.
Looking ahead, the next likely catalyst for Bitcoin and the US dollar will be the upcoming US non-farm payrolls (NFP) data. These are important numbers because they will impact the next actions by the Federal Reserve.
BTC/USD technical analysis
Bitcoin has moved sideways in the past few weeks as investors wait for the next catalyst. It has recently moved below the 50-day moving average and the key support level at 64,960, its highest point last month.
The MACD indicator has moved below the neutral level while the Relative Strength Index (RSI) has dropped below the neutral level.
Bitcoin has also formed a small bearish flag pattern, meaning that it could stage a bearish breakout in the next few days. If this happens, the BTC/USD pair may drop to the next key support level at 54,000.
More upside will be confirmed if Bitcoin bounces back and crosses the important point at 64,960. If this happens, the pair will likely rise and retest the key resistance point at 70,000.
Ready to trade our free Forex signals? Here are the best MT4 crypto brokers to choose from.