Chart of the Day - Bitcoin (16.10.2024)
Bitcoin has surged to $67,782, approaching its three month high as institutional interest in the cryptocurrency reaches new heights. This rally coincides with record-breaking activity in Bitcoin futures and ETFs, signaling growing mainstream adoption.
Key developments driving Bitcoin's price:
- Bitcoin futures open interest on CME has hit a record 172,430 BTC ($11.6 billion)
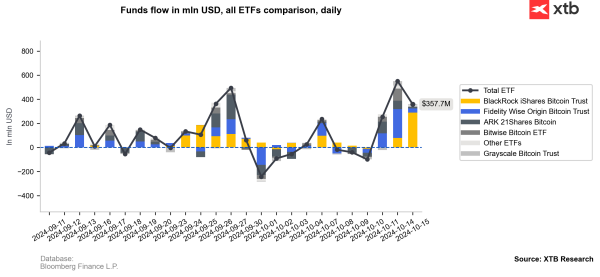
- US spot Bitcoin ETFs have seen over $1 billion in net inflows over the last three trading days
- BlackRock's iShares Bitcoin Trust (IBIT) led with $288.84 million in daily inflows

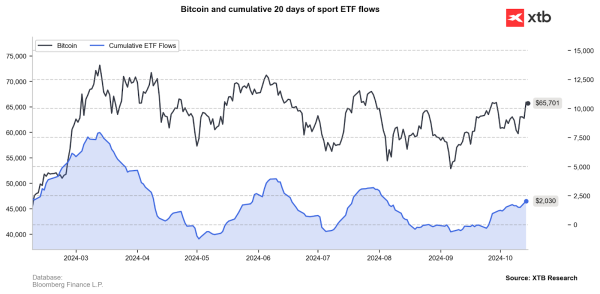
The chart shows a clear uptrend in Bitcoin's price since early October, coinciding with the surge in cumulative ETF flows. This correlation suggests that increased institutional access through ETFs is playing a significant role in driving Bitcoin's price action.

Active and direct market participants are driving CME futures growth, holding 85,623 BTC. This level of institutional involvement mirrors March 2024 when Bitcoin reached its previous all-time high. Increased activity is observed around the November futures expiry, coinciding with the US election.
Some analysts suggest improving odds for Donald Trump's re-election could create a favorable environment for Bitcoin. However, market participants should watch for potential volatility around the US election and any regulatory developments that could impact institutional involvement.
Bitcoin is currently only 9% away from its all-time high of approximately $73,800. The sustainability of this rally will likely depend on continued inflows into Bitcoin ETFs and futures markets, as well as broader macroeconomic factors affecting risk appetite.
As Bitcoin approaches its all-time high, traders and investors should remain vigilant for potential profit-taking or short-term corrections, while also considering the long-term implications of growing institutional adoption on Bitcoin's role in the global financial ecosystem.
Bitcoin (D1 interval)
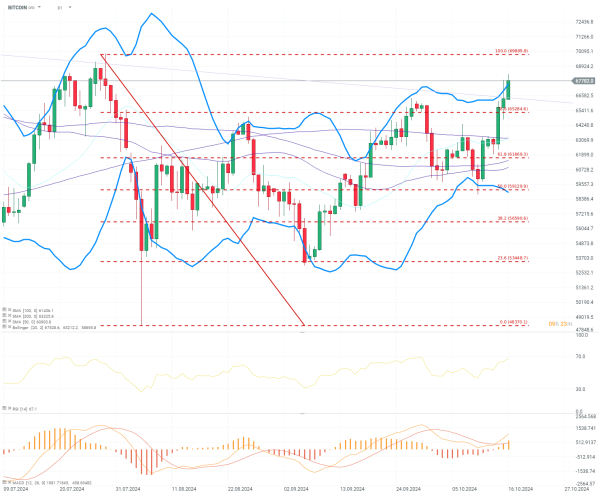
Bitcoin is currently testing the upper Bollinger Band, and if it successfully breaks through, the price could retest the all-time high of $69,900. It has managed to stay above the 78.6% Fibonacci retracement level, which previously served as strong resistance. The RSI is showing strong bullish divergence with higher highs and lows and is nearing oversold territory. Historically, when the RSI approaches the 70 level, it has acted as a key resistance point, often leading to price corrections. However, if the RSI enters oversold territory, the price action could become very bullish, as seen in past rallies.
MACD is also signaling bullish divergence, further reinforcing the potential upward move. A failure to break above the 78.6% Fibonacci level could present an opportunity for bears to regain control.

Source: xStation