Chart of the day - US100 (11.09.2024)
Investors today await the release of U.S. CPI inflation for August (1:30 PM BST), with baseline forecasts calling for a decline in the headline YoY reading (expected at 2.5% after 2.9% in July), and no change in core CPI growth at 3.2% on a yearly basis (excluding food and energy prices). Ahead of the US CPI reading, futures on the Nasdaq 100 (US100) are losing slightly, 0.2%, and managed to recover some of their losses after a downward move overnight, when the index tested the 18500-point area.
- Given current market sentiment (fear of a slowing economy and labor market, and the Fed still 'stuck' at record high rates), the reading could be interpreted negatively, both if the data turns out higher (putting pressure on a more conservative Fed stance, despite the weakening labor market) and in the scenario of lower than expected inflation (which could be interpreted as further 'evidence' of a weakening domestic demand).
- Moreover, the reaction to the CPI may in a sense 'show' the positioning of large investors and funds, who will want to take advantage of higher market liquidity, potentially indicating further movement on the US100. A drop below, 18500 zone could herald another downward impulse and temporary weakness on Wall Street. A rise above 19000 points, on the other hand, could suggest strength on the optimistic side and an 'oversold' on the indexes.
Investors may positively interpret lower US fuel prices, especially if none of the CPI components indicate a significant decline in price dynamics in key economic segments such as services, which could suggest seriously weakening demand inthe US.
US100 (D1, M5 interval)
On the broader daily interval, we see that the Nasdaq 100 (US100) contracts have halted declines at the EMA200 level (red line), but it is worrisome that this average is being tested about a month after the index slipped below it, in early August. A drop below 18550 (23.6 Fibo) and above all 18440 points could be perceived as a potential signal for a trend reversal and create more uncertainty. In the scenario of a deeper correction, important support levels are around 16700 and 17000 points, where we see significant price reactions and the 38.2 Fibonacci retracement of the 2022 upward wave. Looking at recent downtrend impulses, we see that most of them brought a drop of about 3000 points, which in the current hypothetical situation would imply a test of the area around 17000 points. The key medium-term resistance level for the bulls is currently around 20000 points and the EMA100 average, near 19200.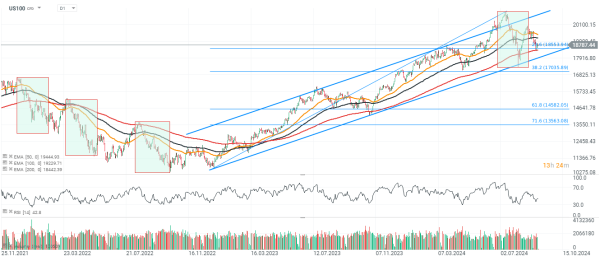
Source: xStation5
On the short 5-minute interval, we see that the price has broken out above the three moving averages (EMA 200,100 and 50), as well as the 23.6 Fibonacci retracement of the September 9 upward wave. We see key short-term resistance near 18860 points.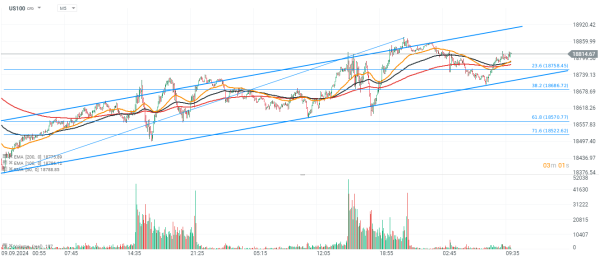
Source: xStation5