Chart of the day: US500 (19.04.2024)
US500 is facing challenges. Futures based on the popular S&P500 index are extending their decline for the third consecutive week and are currently trading around the 100-day exponential moving average. This level may serve as a key support level that will determine whether the bulls can recover or if a deeper correction is in store. With the current closing price of yesterday's session, the world's most important index has retraced 5% from its all-time highs. However, considering the current futures prices, today's declines would bring that figure closer to 6%.
Today, the weakness in the market is primarily driven by the armed conflict in the Middle East, where Israel responded forcefully to recent missile attacks by Iran. The second factor contributing to the market weakness was the reaction to Netflix's quarterly results. The company's stock lost 4% after the close of Wall Street because the management plans to stop disclosing data on new subscription growth from 2025. This has put pressure on the company, despite its strong financial results.
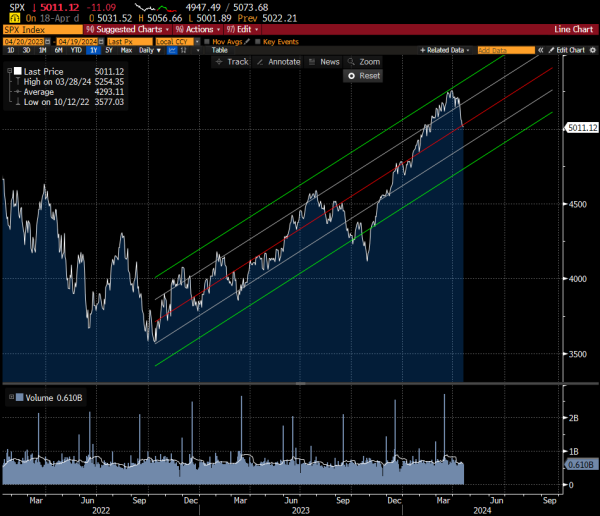
Analyzing the dynamics of the bull market that started in October 2022 and applying regression analysis to it, we can observe that the index is currently within the range of the average values defined by this channel. Source: Bloomberg Financial LP
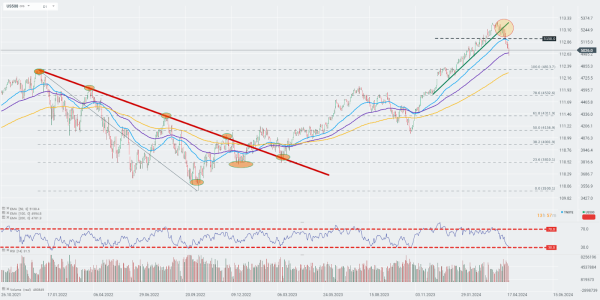
The US500 benchmark is currently trading around the 100-day EMA zone (purple line). The significance of this zone, considering the medium-term trends observed on this index, may be crucial for analyzing potential further market behavior. The key resistance level, in case the indices erase part of the declines, could be around the 50-day EMA zone (blue line). However, a stronger downward breakout could open the way for further declines towards the 200-day EMA zone (gold line). Source: xStation