China Market Rallies: Analysis For Hang Seng, Nikkei 225, ASX, NASDAQ
Hang Seng

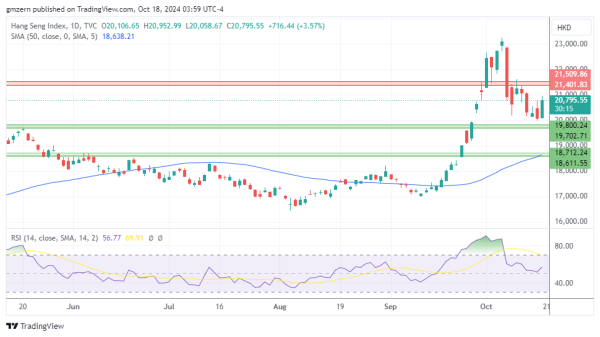
Hang Seng rallied as traders reacted to economic reports. The third-quarter GDP Growth Rate was 4.6% on a year-over-year basis, compared to analyst consensus of 4.5%. Retail Sales increased by 3.2% year-over-year in September, exceeding the analyst estimate of +2.5%. Industrial Production increased by 5.4% year-over-year in September, compared to analyst forecast of +4.6%. Unemployment Rate declined from 5.3% in August to 5.1% in September. The House Price Index report showed that house prices declined by 5.7% year-over-year in September as the housing market remained under strong pressure. Overall, traders focused on the better-than-expected GDP and Retail Sales data and ignored housing market problems.
In case Hang Seng climbs above the 21,000 level, it will move towards the next resistance level at 21,400 – 21,500.
Nikkei 225

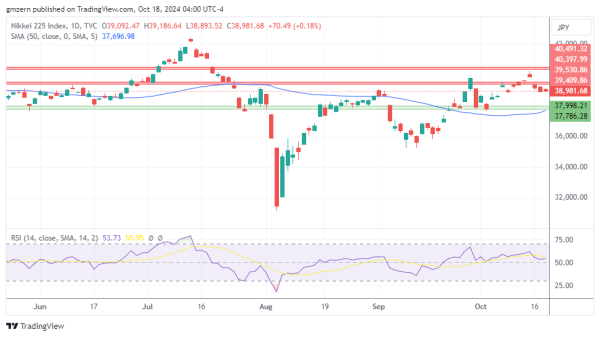
Nikkei 225 was mostly flat as traders focused on inflation data. Inflation Rate declined from 3% in August to 2.5% in September, compared to analyst forecast of 2.7%. Core Inflation Rate decreased from 2.8% to 2.4%, while analysts expected that it would drop to 2.3%.
From the technical point of view, Nikkei 225 settled below the previous support at 39,400 – 39,500 and is moving towards the next support level at 37,800 – 38,000.
ASX

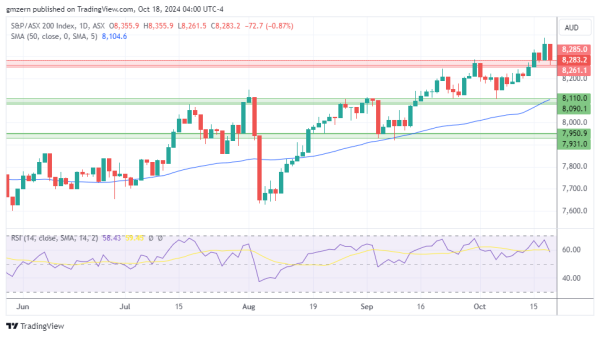
ASX pulled back as traders took some profits off the table near historic highs.
In case ASX declines below the 8260 level, it may gain additional downside momentum and move towards the 8200 level. A move below 8200 will open the way to the test of the support at 8090 – 8110.
NASDAQ

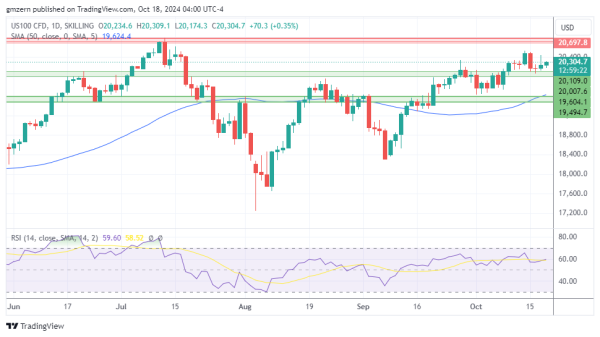
NASDAQ continues to rebound after the recent pullback amid rising demand for tech stocks. The better-than-expected Retail Sales report, which was released on Thursday, provided additional support to NASDAQ.
In case NASDAQ manages to settle above the 20,500 level, it will head towards the nearest resistance level, which is located in the 20,700 – 20,800 range.
For a look at all of today’s economic events, check out our economic calendar.