
InstaForex Arief Makmur
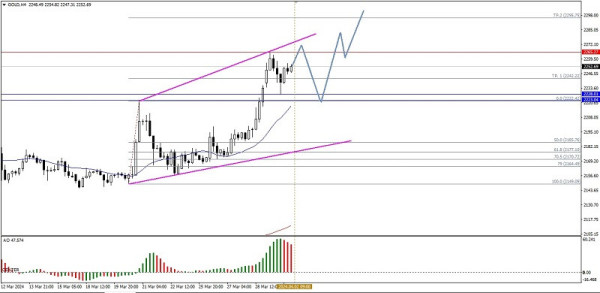
Technical Analysis of Intraday Price Movement of Gold Commodity Asset, Tuesday April 02, 2024.
With the price movement inside the MA 200 and MA 20 on the 4 hour chart of Gold commodity asset, then we can confirmed if Gold currently on the strengthen condition where it means the Buyers more dominant, so based on this fact in the near future, Gold wi...
6 months ago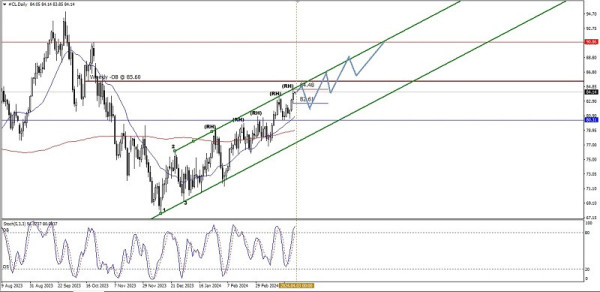
Technical Analysis of Daily Price Movement of Crude Oil Commodity Asset, Tuesday April 02, 2024.
From what we seen on the daily chart of Crude Oil commodity asset, there is seems the price movement which is moving above MA 20 & MA 200 as well as inside the Equisidant Channel that has the upward slope, so that based on these facts, gives the clue...
6 months ago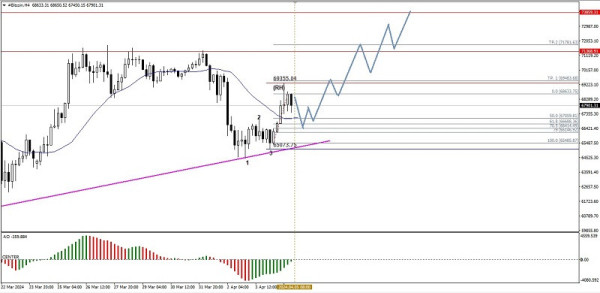
Technical Analysis of Intraday Price Movement of Bitcoin Cryptocurrency, Friday April 05 2024.
On the 4-hour chart of the Bitcoin cryptocurrency, it appears that its price movement is above WMA 30 Shift 2, which shows that buyers are still dominant even though the momentum condition is still flat, as indicated by the slope of WMA 30 Shift 2, which...
6 months ago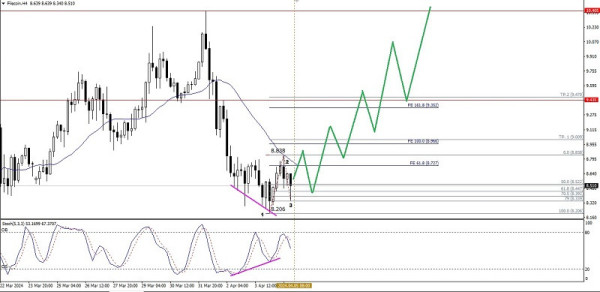
Technical Analysis of Intraday Price Movement of Filecoin Cryptocurrency, Friday April 05 2024.
With the appearance of the Bullish 123 pattern which is followed by a deviation between the price movement of the Filecoin cryptocurrency and the Stochastic Oscillator indicator on the 4-hour chart, in the near future as long as there is no weakening that...
6 months ago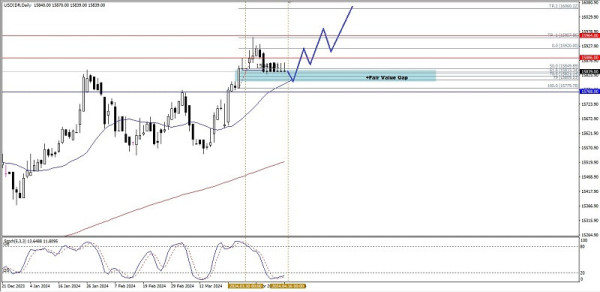
Technical Analysis of Daily Price Movement of USD/IDR Exotic Currency Pairs, Tuesday April 16, 2024.
If you look at the daily chart, the exotic currency pair USD/IDR appears to be moving above its 200 MA and the Stochastic indicator which is already at the oversold level and is stuck at the level of the Bullish Fair Value Gap area which acts like a level...
6 months ago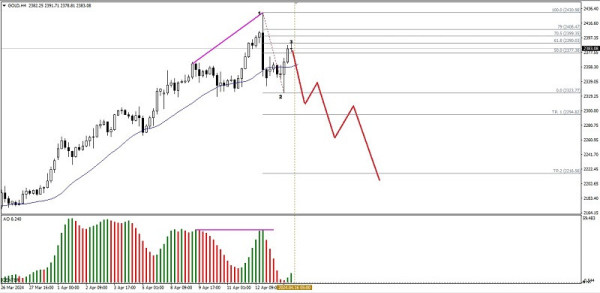
Technical Analysis of Intraday Price Movement of Gold Commodity Asset, Tuesday April 16, 2024.
With the appearance of the Bearish 123 pattern which is followed by a deviation between the Gold price movement and the Awesome Oscillator indicator, these two things give an indication that in the near future there will be a weakening correction in the G...
6 months ago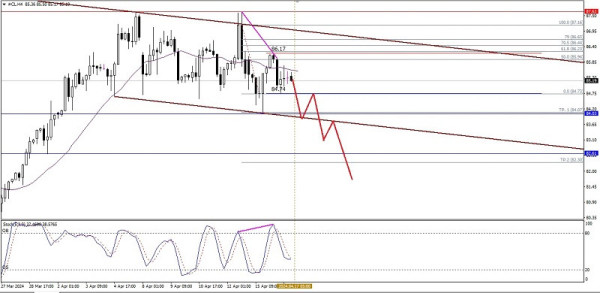
Technical Analysis of Intraday Price Movement of Crude Oil Commodity Asset, Wednesday April 17, 2024.
With the existence of Crude Oil commodity price movements in the Equisidant Channel which have a downward slope and the appearance of hidden deviations on the 4-hour chart, #CL in the near future has the potential to fall to test level 84.73. If this leve...
5 months ago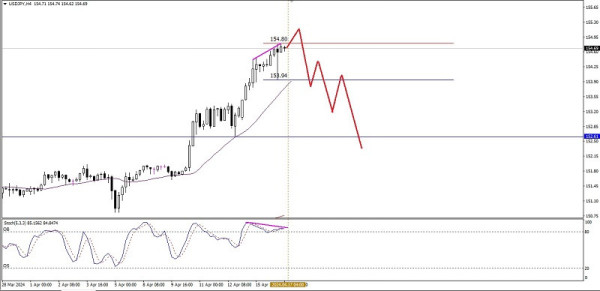
Technical Analysis of Intraday Price Movement of USD/JPY Main Currency Pairs, Wednesday April 17, 2024.
Even though the condition of the main currency pair USD/JPY on the 4-hour chart is in a strengthening condition, which is confirmed by its price movement moving above WMA 30 Shift 2, the appearance of deviations between price movements and the Stochastic...
5 months ago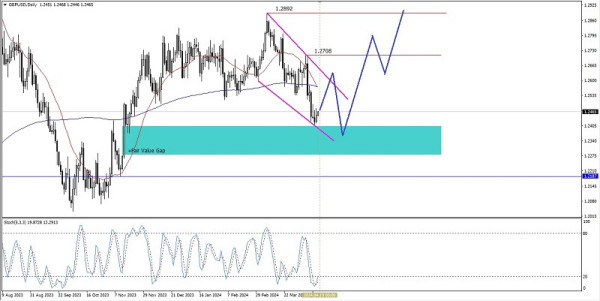
Technical Analysis of Daily Price Movement of GBP/USD Main Currency Pairs,Thursday April 18 2024.
Based on what can be seen on the daily chart, the main currency pair GBP/USD seems that in the near future the Cable has the potential to strengthen upwards again, where this is confirmed by the appearance of a Failing Wedge pattern which also at the same...
5 months ago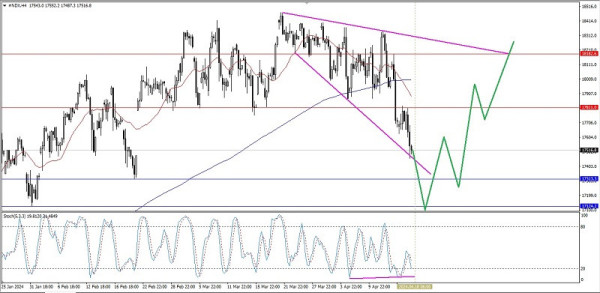
Technical Analysis of Intraday Price Movement of Nasdaq 100 Index, Thursday April 18 2024.
Even though currently on the 4-hour chart the Nasdaq 100 index has a Death Cross crossing between the 50 and 200 MAs, the appearance of the Descending Broadening Wedge pattern and the deviation between price movements and the Stochastic Oscillator indicat...
5 months ago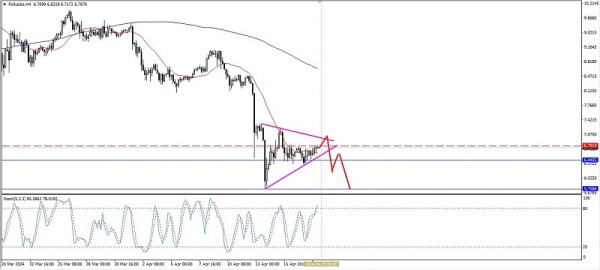
Technical Analysis of Intraday Price Movement of Polkadot Cryptocurrency, Friday April 19 2024.
Although currently on the 4 hour chart Polkadot Cryptocurrency is inside the selling pressure where this is confirmed by MA 20 which is below MA 200 (Death Cross) as well as Stochastic Oscillator which is on the overbought level, but with the MA 20 condit...
5 months ago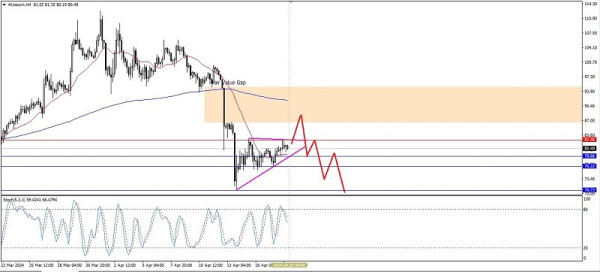
Technical Analysis of Intraday Price Movement of Litecoin Cryptocurrency, Friday April 19 2024.
From what wee seen on the 4 hour chart of Litecoin cryptocurrency, we can conclude that currently still inside the selling pressure where this weakness confirmed by the Death Cross of MA 20 which is under MA 200, as well as the appearance of Rising Wedge...
5 months ago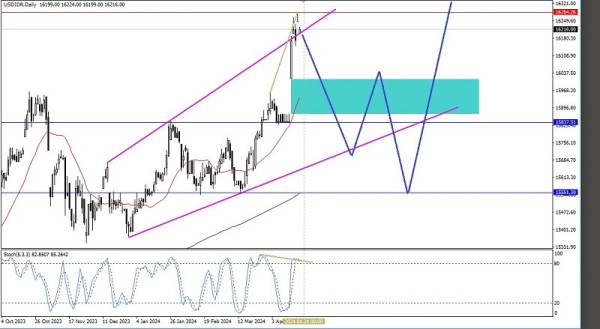
Technical Analysis of Daily Price Movement of USD/IDR Exotic Currency Pairs , Monday April 22, 2024.
Based on the daily chart of the exotic currency pair USD/IDR, there is potential for correction of the weakening of the United States Dollar against the Garuda currency (Rupiah) as indicated by the appearance of the Ascending Broadening Wedge pattern and...
5 months ago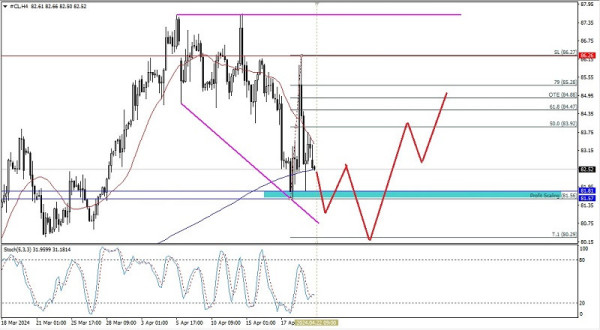
Technical Analysis of Intraday Price Movement of Crude Oil Commodity Asset , Monday April 22 2024.
With the appearance of Descending Broadening Wedge pattern on the 4 hour chart, Crude Oil commodity asset gives the clue that in the near future #CL has the potential to have a strengthening correction upward, as long as there is no continuing weakness wh...
5 months ago