
InstaForex Stefan Doll
Indicator Analysis of EUR/USD on April 2, 2024
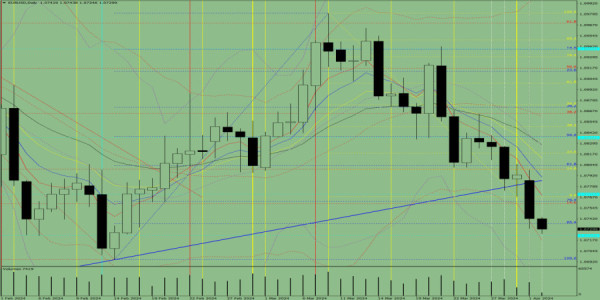
Trend analysis (Fig. 1).The EUR/USD currency pair may move downward from the level of 1.0743 (closing of yesterday's daily candle) to test the historical support level at 1.0723 (blue dotted line). After that, an upward movement is possible to the 14.6% p...
6 months ago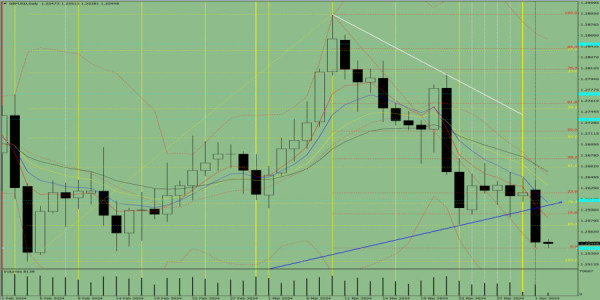
Indicator Analysis of GBP/USD on April 2, 2024
Trend analysis (Fig. 1).The GBP/USD currency pair may move upward from the level of 1.2547 (closing of yesterday's daily candle) to test the 14.6% pullback level at 1.2590 (red dotted line). Upon reaching this level, a continued upward movement is possibl...
6 months ago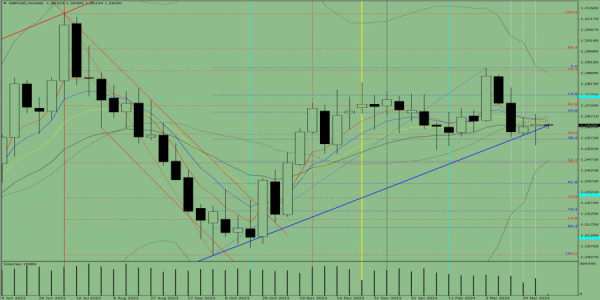
Technical analysis of GBP/USD for April 8-13, 2024
Trend analysisGBP/USD may resume an upward movement this week, starting from the level of 1.2634 (closing price of the last weekly candle) to the 61.8% retracement level of 1.2719 (red dashed line). Following this, the pair will climb to the 14.6% retrace...
6 months ago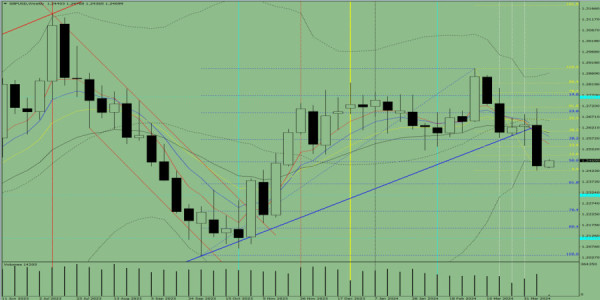
Technical analysis of GBP/USD for April 15-20, 2024
Trend analysisGBP/USD may move upward this week, starting from the level of 1.2445 (closing price of the last weekly candle) to the 14.6% retracement level of 1.2493 (yellow dashed line). Following this, the pair will climb to the 23.6% retracement level...
6 months ago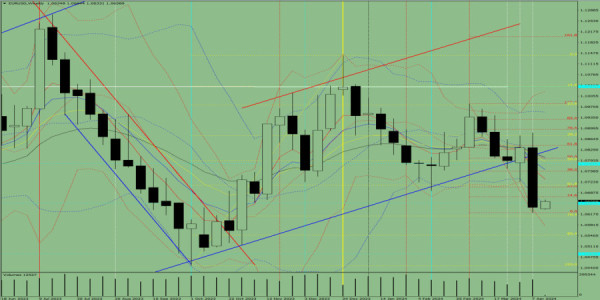
Technical analysis of EUR/USD for April 15-20, 2024
Trend analysisEUR/USD may start a corrective upward movement this week, rising from 1.0640 (closing price of the last weekly candle) to the 23.6% retracement level of 1.0706 (red dashed line). Upon reaching this level, the pair will move downwards toward...
6 months ago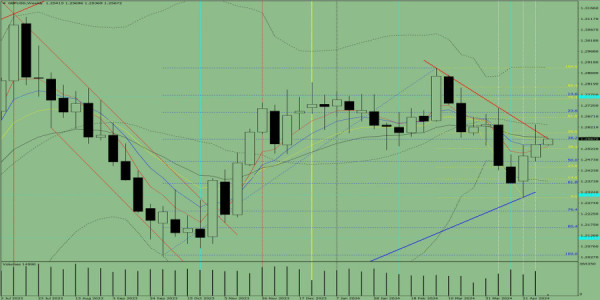
Technical analysis of GBP/USD for week on May 6-11
Trend-following analysis This week, from 1.2542, the closing level of the last weekly candle, GBP/USD may continue to move upward with a target of 1.2665, the retracement level of 61.8% plotted by the yellow dotted line. Once this level is reached, the pr...
5 months ago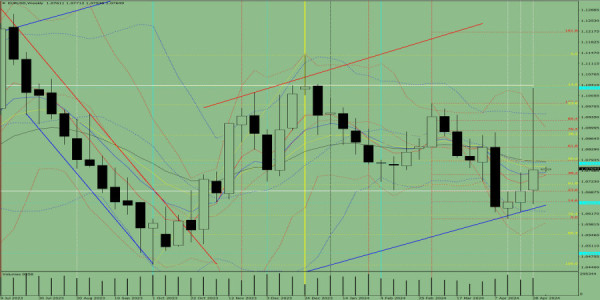
Technically analysis of EUR/USD for week on May 6-11
Trend-following analysis (picture 1) This week, from the level of 1.0761 (the closing level of the last weekly candle), the instrument may begin a pullback movement downwards with a target of 1.0746, the Fibonacci level of 38.2% plotted by the red dotted...
5 months ago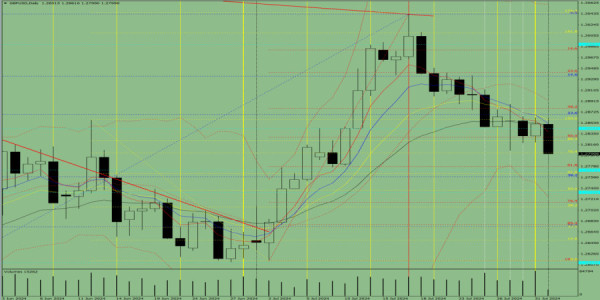
Indicator analysis: Daily review of GBP/USD on August 1, 2024
Trend Analysis (Fig. 1)Today, GBP/USD may sustain the decline from 1.2852 (the close of yesterday's daily candle) with a target of 1.2778 – the 61.8% pullback level (red dashed line). Upon reaching this level, the price may start rising with a target of 1...
2 months ago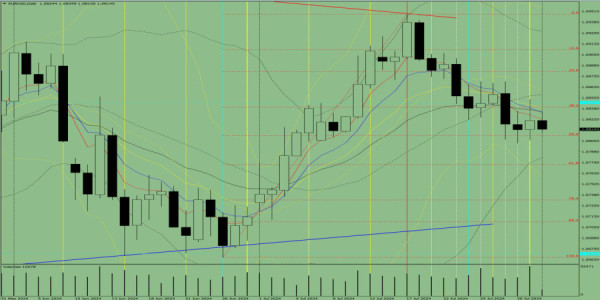
Indicator analysis: Daily review of EUR/USD on August 1, 2024
Trend Analysis (Fig. 1)Today, EUR/USD may continue to fall from 1.0824 (the close of yesterday's daily candle) with a target of 1.0807 – the 50% pullback level (red dashed line). Upon reaching this level, the price may start rising with a target of 1.0845...
2 months ago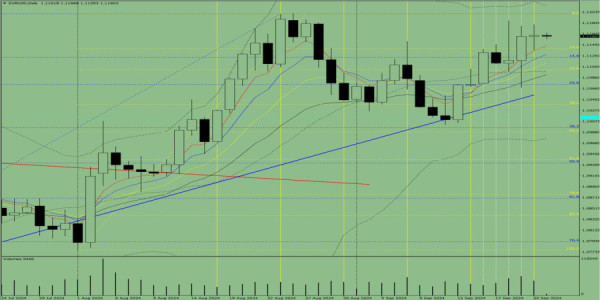
Indicator analysis of EUR/USD on September 23, 2024
Trend-following analysis (figure 1) On Monday, the market may start moving down from the level of 1.1162 (Friday's daily candle close), targeting 1.1138, which is the 14.6% retracement level (yellow dashed line). From this level, the price could begin to...
3 weeks ago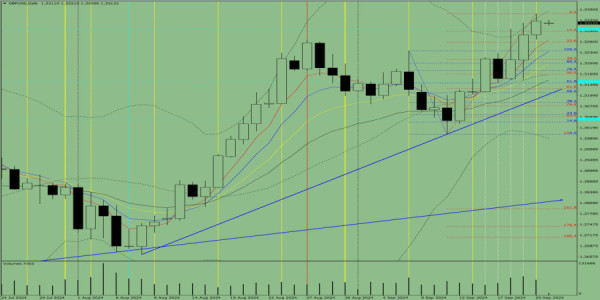
Indicator analysis of GBP/USD on September 23, 2024
Trend-following analysis (figure 1) On Monday, the market may try to start moving down from the level of 1.3318 (Friday's daily candle close), targeting 1.3289 – the 14.6% retracement level (red dashed line). From this level, the instrument is likely to c...
3 weeks ago