Crude Oil Price Forecast: Maintains Critical Support; Awaiting Breakdown or Bull Reversal
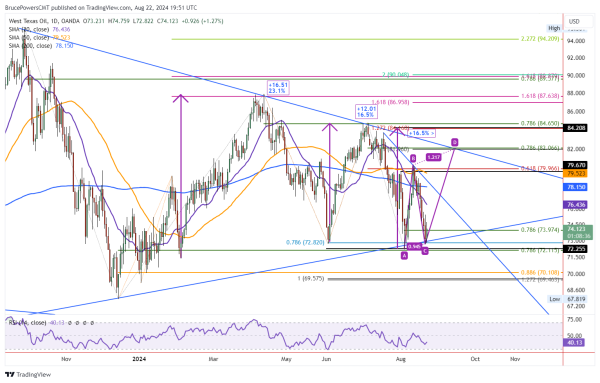
Crude oil pulled back to a low of 72.82 on Thursday, providing a second test of support around Wednesday’s low of 72.71. A 78.6% Fibonacci retracement was completed during the decline at 72.82. Notice that this was the second decline to the 78.6% price zone with the early-August drop being the first. Today, will likely end as an inside day. Therefore, a rally above the high at 74.76 is a sign of strength, and a decline below today’s low of 72.82 a sign of weakening.
Sitting at Support of Large Symmetrical Triangle Formation
Lows this week in the price of crude oil are testing support at the bottom boundary line of a large symmetrical triangle consolidation pattern. It has been forming for approximately eight months. Given the size of the pattern a breakout, either up or down, may be followed by a spike in volatility as the market seems to recognize the pattern. Take the 50-Month MA on the monthly chart (not shown).
That moving average has done a good job since May 2023 of defining support. It was tested as support and held, leading to a bullish reversal, during seven months since then. However, since Monday it has been trading below the 50-Month line. Moreover, if crude stays weak into the end of the month it could potentially close below the 50-Month MA for the first time since November 2020. This would be a bearish indication but will require additional confirmation.
Breakdown Triggered Below 72.71
A breakdown from the triangle will be triggered by a decisive decline below Wednesday’s low of 72.71. The next lower trigger level would then be at the August 5 swing low of 72.24. Nevertheless, to guard against false breakdowns the bearish move would be confirmed by a daily close below 72.71. As with any breakout, follow-through is key.
Strength Indicated Above 74.76, then 75.46
On the upside, if this week’s support leads to a bullish reversal crude could be heading back towards the top line of the triangle. A rally above today’s high of 74.76 will show strength that will be further confirmed on an advance above Wednesday’s high of 75.46. Notice that a new rising ABCD pattern has been added to the chart considering this week’s swing low. If it remains a swing low and leads to a bullish reversal the initial target from the pattern is at 81.96.
For a look at all of today’s economic events, check out our economic calendar.