Crude Oil Price Forecast: Rebounds from Support, Triggering a Bullish Reversal
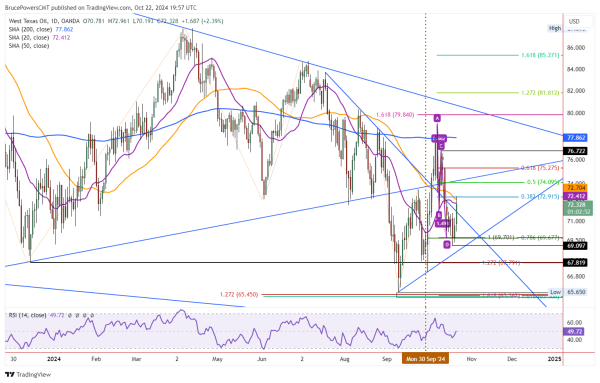
Crude oil triggered a bullish reversal on Tuesday as it broke out above Mondays inside day to hit a high of 72.96 for the day. Both the 20-Day and 50-Day MAs were exceeded to the upside briefly before resistance kicked in. A daily close above the 20-Day MA and then the 50-Day MA would be a sign of strength and confirm the bullish reversal.
At the time of this writing, crude oil has pulled back to resistance around the 20-Day MA. However, it continues to reflect strength if the day ends in the top third of today’s range. One third of the range down is at 72.04. The 20-Day MA is at 72.43 and the 50-Day line is at 72.71, currently.

Correction of 12.6% Looks Done
Last week’s low of 69.10 completed a 10.00 point or 12.6% decline in the price of crude oil, from the 79.09 October peak. Support was found around the 78.6% retracement and the completion of a falling ABCD pattern (purple), at 69.68 and 69.70, respectively. Therefore, this should be a solid bottom that leads to a continuation of today’s advance as two indicators have marked a similar price. Today’s bullish reversal further confirms that likelihood.
Next Higher Target at 74.10, the 50% Retracement
A 38.2% Fibonacci retracement was completed today at 72.9. The advance reclaimed the internal downtrend line on the chart before stalling around the moving averages. Next up is the 50% retracement target at 74.10. Notice that it is near resistance of the lower uptrend line defining the bottom of a large symmetrical triangle pattern. A bearish breakdown from the pattern triggered on September third.
However, a bullish reversal and the beginnings of a potential failure of the breakdown subsequently occurred following the September swing low of 65.65. On October 3, a month after the initial breakdown, crude rallied back up and into the triangle consolidation pattern thereby putting it in a position to challenge resistance at the other side of the pattern. It remains to be seen whether ultimately the bearish breakdown or bullish reversal (potential pattern failure) of the triangle will dominate and follow-through.
Price Structure Marks Key Levels
Key price parameters for crude oil based on price structure are at last week’s low of 69.10 and the most recent interim swing high at 76.72. A bearish continuation is indicated on a drop below 69.10, and a bullish reversal is confirmed by price structure on an advance above 76.72.
For a look at all of today’s economic events, check out our economic calendar.