Elon Musk, Golden Cross Send Dogecoin (DOGE) Soaring to 4-Month High
Dogecoin (DOGE), the popular meme cryptocurrency, has surged to its highest levels in four months, spurred by a familiar combination of Elon Musk’s influence and a bullish technical setup.

Musk is Going All-in on D.O.G.E.
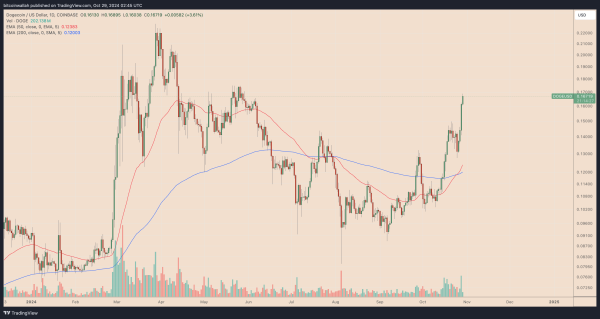
The DOGE price has rallied by over 25% in the past three days, hitting $0.169 on Oct. 29, its highest level since June 2024.
Its rise surfaced primarily after Musk’s appearance at the Donald Trump rally at Madison Square Gardens in New York, where he committed to American taxpayers $2 trillion through his brainchild agency, the Department of Government Efficiency, or D.O.G.E.
The rally picked momentum after Musk’s cryptic tweet involving Dogecoin. In the post, the billionaire entrepreneur shared an image of himself at the Trump event, flexing his arms in a victorious pose.
The post humorously mimicked a bodybuilding image by merging his photograph with the iconic Shiba Inu dog from the Dogecoin logo, edited to appear as if the dog were flexing its muscles.
pic.twitter.com/y0UCd5NvMj
— Elon Musk (@elonmusk) October 28, 2024
For Dogecoin enthusiasts, this shared acronym was just the latest nod from Musk toward the memecoin, reigniting speculation that he may still be tacitly supporting its growth.
Dogecoin Technical Analysis: Golden Cross Hints at Sustained Uptrend But…
In addition to Musk, Dogecoin’s rally is taking cues from a classic technical setup.
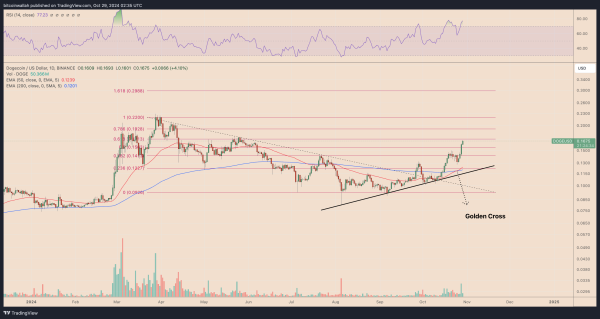
A “Golden Cross” recently formed on Dogecoin’s daily chart, traditionally considered a bullish indicator. It occurs when the 50-day moving average (MA) crosses above the 200-day MA, suggesting a shift in long-term trend momentum.
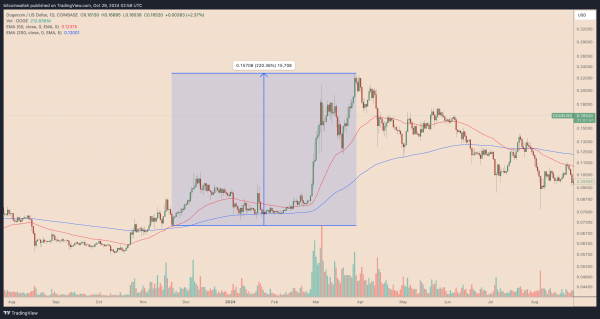
Historically, a Golden Cross on the DOGE/USD chart has preceded strong upward moves, including a 200%-plus price boom between November 2023 and March 2024. The same sentiment appears to have been driving the DOGE prices higher these days.

However, DOGE’s upside momentum may be exhausted in the short term because its relative strength index (RSI) is overbought, with a reading above 77.
In previous instances, DOGE has faced notable price pullbacks whenever its RSI reached overbought levels, sometimes retracing to the 50-day EMA or lower. Given this historical pattern, traders may need to brace for a potential downside correction if selling pressure builds.

If the overbought RSI prompts a reversal, potential downside targets include:
- $0.14 (50-day EMA): This level served as resistance in mid-2024 and could act as support during a corrective move, aligning closely with the 0.236 Fibonacci level.
- $0.12 (200-day EMA): A more substantial correction could drive DOGE down to retest this level, which coincides with the 0.236 Fibonacci retracement level of the previous uptrend.
Conversely, a continued uptrend above the current resistance level of $0.171 may have the DOGE test of $0.192 as its primary upside target. However, any rally from the current prices may prove unsustainable due to the overbought correction risks.