EUR/GBP, EUR/JPY, USD/JPY try to stabilize ahead of FOMC
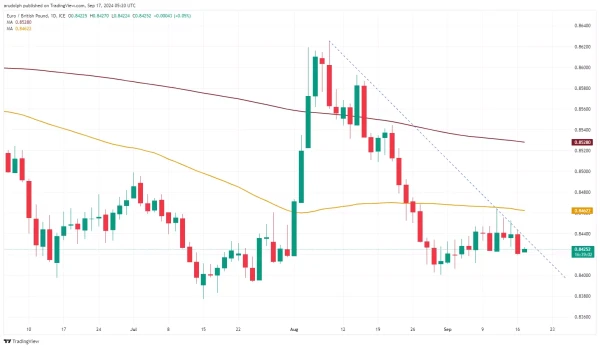
EUR/GBP under pressure
EUR/GBP remains below its 55-day simple moving average (SMA) at £0.8462 and revisits Wednesday's £0.8423 low. Below it lie the 6 September £0.8412 low and the June-to-July lows at £0.8398-to-£0.8378.
A rise above £0.8465 would likely target minor resistance at the 19 August low at £0.8509.
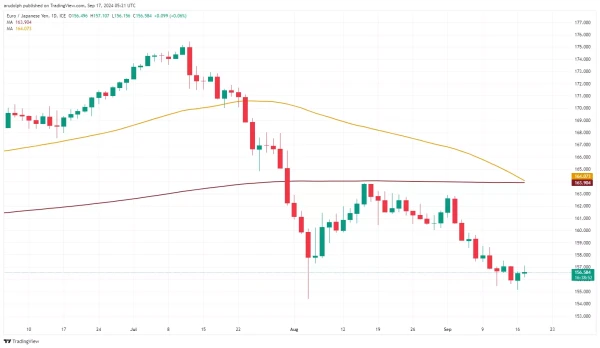
EUR/JPY tries to level out
EUR/JPY is trying to stabilize above its ¥154.42 early August low and revisit Thursday's high at ¥157.51.
Were it to be bettered, the 10 September high at ¥158.64 would be back in sight.
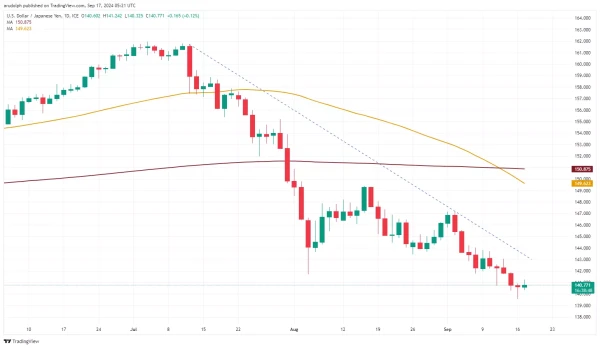
USD/JPY trades above 9-month low
USD/JPY flirts with the minor psychological ¥140.00 region, below which lie Monday's low at ¥139.59 and the 28 July 2023 low at ¥138.07.
Resistance can now be spotted at the 5 August low at ¥141.70.