EUR/GBP, EUR/USD and GBP/USD await US non-farm payrolls
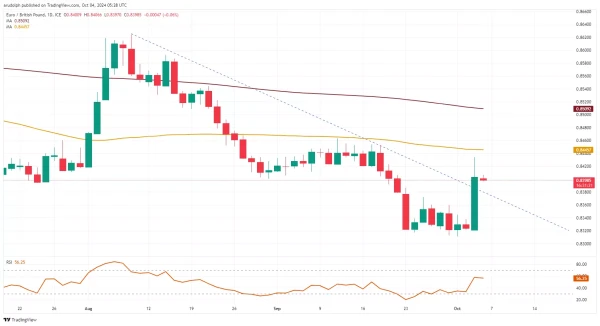
EUR/GBP saw huge rally
EUR/GBP's rally off its near 2 1/2 year £0.8311 low has taken it close to the 55-day simple moving average (SMA) at £0.8445 which is expected to cap on Friday, together with Thursday's £0.8434 high. Further up resistance can be spotted at the £0.8463 high.
The breached August-to-October downtrend line at £0.8380 as well as the 25 September high at £0.8372 may act as short-term support.
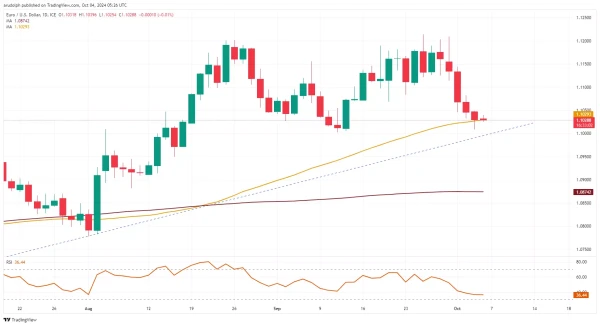
EUR/USD test key support
EUR/USD slid to but so far held around the $1.1002 September low, a fall through this level would be short-term bearish and put the mid-July high at $1.0948 back on the cards.
For now the cross continues to oscillate around its 55-day SMA at $1.1029 though with the 19 to 23 September lows at $1.1069-to-$1.1083 acting as resistance. While this zone caps, downside pressure should be maintained.
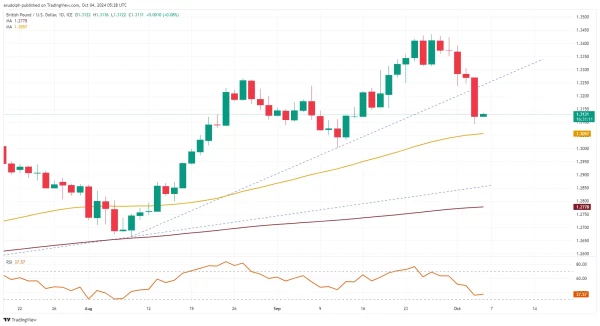
GBP/USD drops further
GBP/USD has so far fallen to $1.3093 on dovish comments by the Bank of England (BoE) governor Andrew Bailey and remains on track for the 55-day SMA and the September low at $1.3057-to-$1.3002. This support zone is key for the medium-term trend as a fall through it could lead to the 200-day SMA at $1.2778 being revisited.
While the $1.30 mark underpins, the medium-term uptrend remains intact though. Minor resistance can be found at the early September high at $1.3239.