EUR/GBP rallies while EUR/USD, GBP/USD drop further amid greenback strength
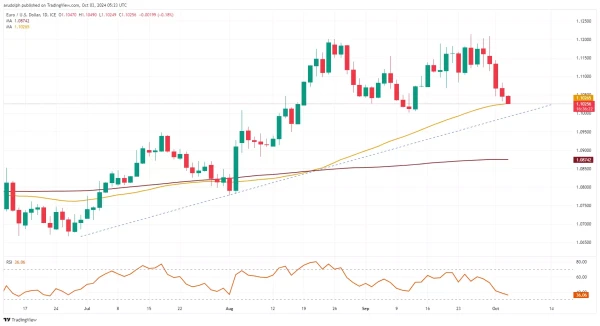
EUR/USD slips further
EUR/USD further comes off its $1.1201-to-$1.1214 August and September highs on flight-to-quality flows into the US dollar amid heightened tensions in the Middle East.
Minor support below the 55-day simple moving average (SMA) at $1.1027 sits at the $1.1002 September trough. A fall through this level would form a medium-term top. Minor resistance can now be seen at the 19 September low at $1.1069.
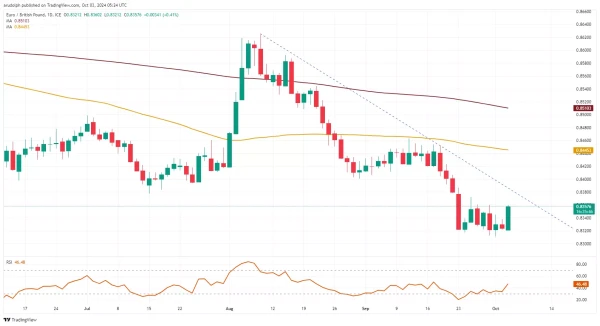
EUR/GBP rallies
EUR/GBP recovers from its near 2 1/2 year £0.8311 low towards the £0.8373-78 resistance zone which may cap on Thursday.
Significant support below £0.8311 sits between the 21 March 2022 low at £0.8296, the £0.8285 January 2022 low and the £0.8277 December 2019 low.
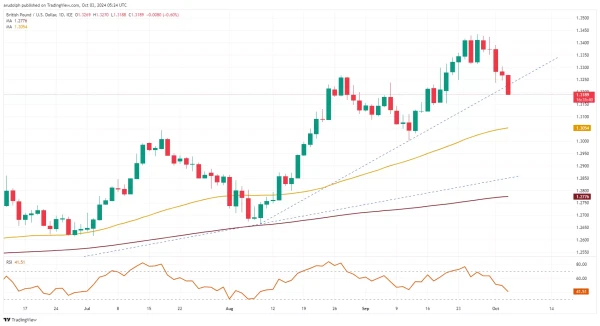
GBP/USD tumbles further
GBP/USD has nearly given back 2% from its $1.3434 September peak while falling towards the 19 September low at $1.3154. Further down meanders the 55-day SMA and lie the July high and September low at $1.3045-to-$1.3002.
Minor resistance can now be found between the 23 September and 1 October lows at $1.3237-to-$1.3249.