EUR/GBP tries to recover as EUR/JPY and USD/JPY continue to rise
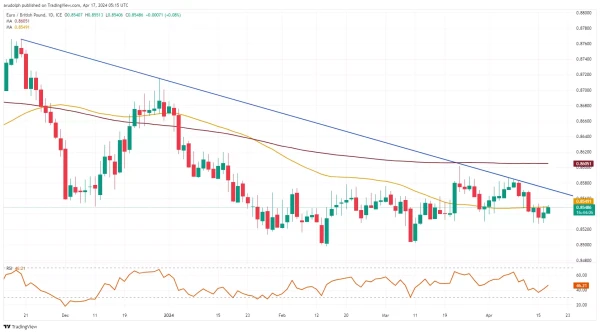
EUR/GBP holds at support
EUR/GBP tries to overcome the 55-day simple moving average (SMA) at £0.8549 and reach the £0.856 to £0.857 zone.
On Monday the cross slid to £0.8527, below which lies the £0.8499 February low.
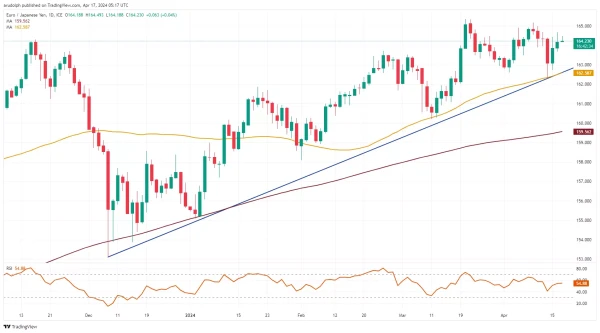
EUR/JPY grinds higher
EUR/JPY has Tuesday's ¥164.67 high in view above which beckons key resistance at ¥165.17 to ¥165.35, the March and current April highs.
This bullish outlook will remain valid while Friday's low at ¥162.28 underpins.
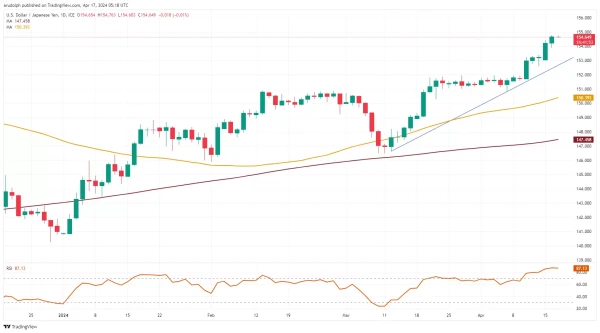
USD/JPY is getting ever closer to ¥155.00
USD/JPY nears the ¥155.00 mark around which the Bank of Japan may intervene.
Upside pressure will remain in play while Friday's low at ¥152.60 underpins. Were this level to give way, however, the ¥151.97-91 area might be back in play.