EUR/JPY, USD/JPY probe key resistance while AUD/USD tries to hold
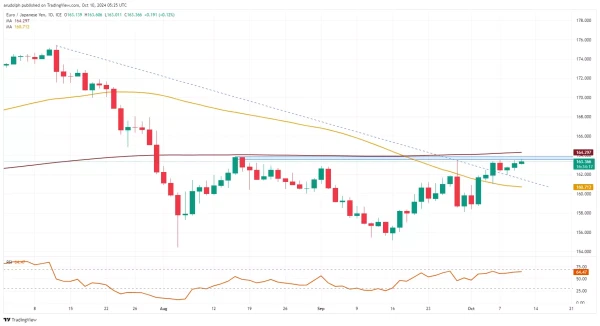
EUR/JPY probes resistance
EUR/JPY retests the ¥162.89-to-¥164.24 resistance zone. Were it to be bettered, a medium-term bullish reversal would be in the making.
Potential slips may find support between Friday's low and the 55-day simple moving average (SMA) at ¥161.01-to-¥160.71.
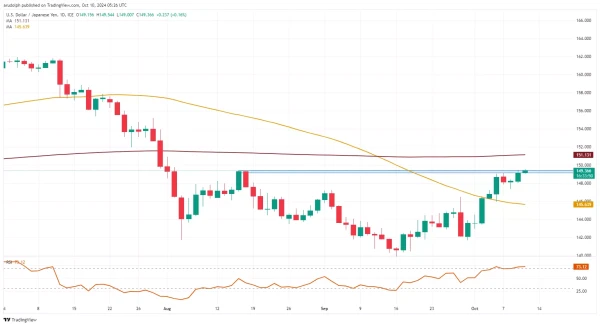
USD/JPY tests key resistance
USD/JPY is trying to overcome the mid-August high at ¥149.40, a rise and daily chart close above which would likely lead to a medium-term bullish reversal taking place.
Support remains to be seen between the early September high at ¥147.21, the late September high at ¥146.49 and Friday's low at ¥145.93.
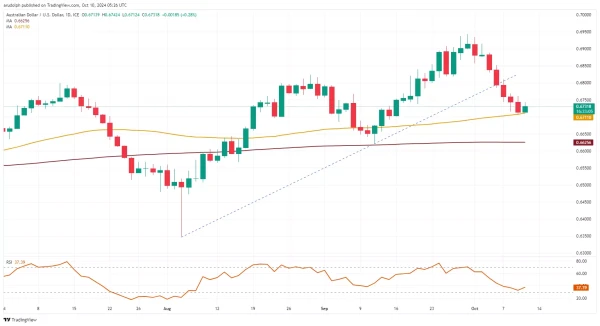
AUD/USD tries to find support
Following five straight days of falls, AUD/USD is trying to level out along the 55-day SMA at $0.6711 and the 22 August low at $0.6698. Below these levels lies the September trough at $0.6623.
Minor resistance can be spotted at the 26 September low at $0.6819.