EUR/JPY, USD/JPY rally to multi-decade highs while EUR/GBP drops
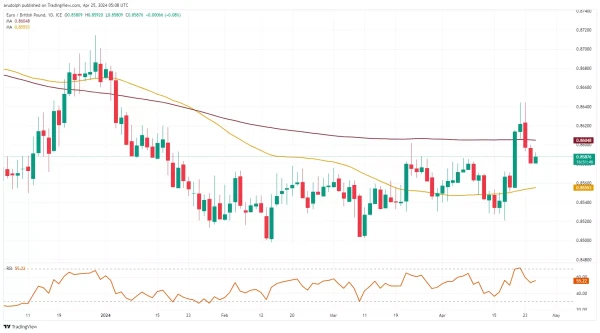
EUR/GBP is coming off further still
EUR/GBP has short-term topped out at £0.8644 and weighs on the £0.8586 to £0.858681 support zone. Below it lies the 17 April high at £0.8572 and then meanders the 55-day simple moving average (SMA) at £0.8553.
Minor resistance is seen along the 200-day SMA at £0.8605.
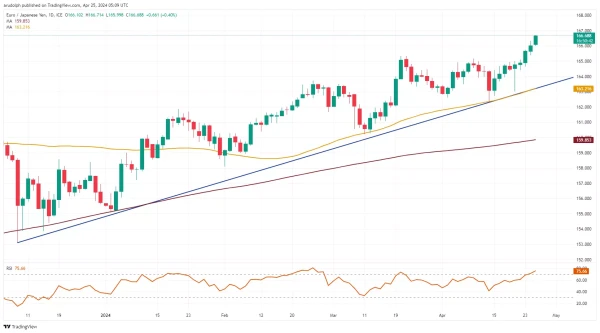
EUR/JPY eyes October 2007 high
EUR/JPY is rapidly advancing towards the October 2007 high at ¥167.74 while trading at levels last seen in 2008.
Minor support is found at the 20 March high at ¥165.35.
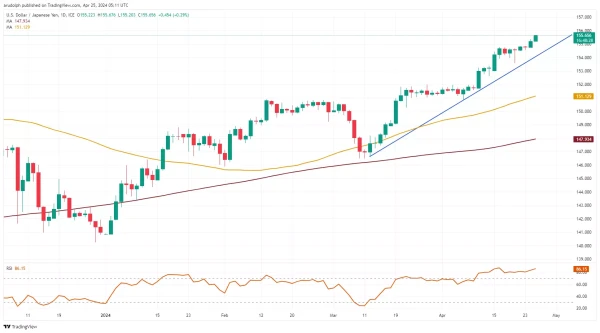
USD/JPY grapples with June 1990 peak
USD/JPY has overcome the ¥155.00 mark as the Bank of Japan (BoJ) meeting gets underway and has reached the June 1990 peak at ¥155.56 which it is trying to overcome. The next upside target is a 61.8% Fibonacci extension at ¥158.57.
Upside pressure will remain in play while Friday's low at ¥153.60 underpins.