EUR/USD Ahead of PCE Price Index Numbers
Europe’s single currency is poised to end the week on the back foot versus its US counterpart and snap a two-week bullish phase. As of writing, the currency pair is down by -0.9%.
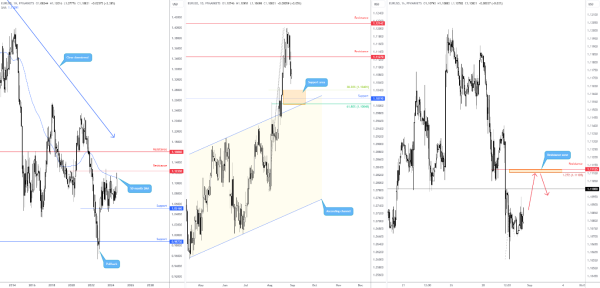
50-Month SMA Resistance
Starting from the monthly chart, the 50-month simple moving average (SMA) at US$1.1109 currently offers dynamic resistance, a line situated just south of resistance at US$1.1233. Together, this area could prove difficult to overcome. Should bulls eventually maneuver beyond the said area, nevertheless, and explore territory beyond the US$1.1276 peak (July 2023), this would be noteworthy and signal the beginnings of a longer-term uptrend for the pair.
Scope to Continue Southbound
Leaving resistance at US$1.1214 unchallenged, price action on the daily timeframe dethroned support at US$1.1127 (now marked resistance) and has opened the floor for further underperformance to support coming in at US$1.1019. This is joined by a channel resistance-turned-support line taken from the high of US$1.0916, as well as 38.2% and 61.8% Fibonacci retracement ratios at US$1.1040 and US$1.1005, respectively.
Overall, the trend is higher on the daily timeframe and the recent correction may be viewed as a dip-buying opportunity, particularly at support between US$1.1005 and US$1.1040.
H1 Resistance Above US$1.11
Ahead of the PCE Price Index release, we can see price action flirting with space south of the US$1.11 handle. Big figures are widely watched and traded numbers. Therefore, given that the trend is to the downside in the short term and the room seen to continue lower on the daily timeframe, a test of US$1.11 as resistance would be logical. Still, given resistance situated above US$1.11 between US$1.1113 and US$1.1111 (1.272% Fibonacci projection ratio), a whipsaw north of US$1.11 could also be seen (red arrows).
DISCLAIMER:
The information contained in this material is intended for general advice only. It does not take into account your investment objectives, financial situation or particular needs. FP Markets has made every effort to ensure the accuracy of the information as at the date of publication. FP Markets does not give any warranty or representation as to the material. Examples included in this material are for illustrative purposes only. To the extent permitted by law, FP Markets and its employees shall not be liable for any loss or damage arising in any way (including by way of negligence) from or in connection with any information provided in or omitted from this material. Features of the FP Markets products including applicable fees and charges are outlined in the Product Disclosure Statements available from FP Markets website, www.fpmarkets.com and should be considered before deciding to deal in those products. Derivatives can be risky; losses can exceed your initial payment. FP Markets recommends that you seek independent advice. First Prudential Markets Pty Ltd trading as FP Markets ABN 16 112 600 281, Australian Financial Services License Number 286354.