EUR/USD at a Crossroads: What’s Next?
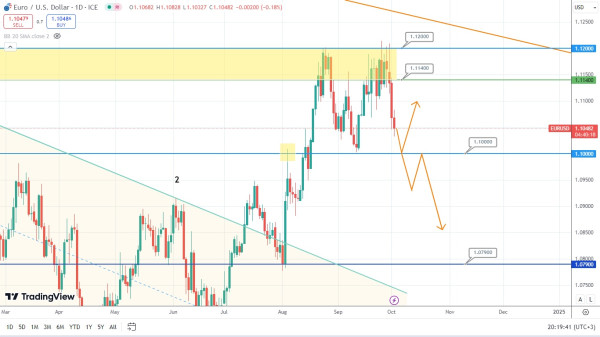
The price of the currency pair EUR/USD rebounded from the resistance area. It is currently approaching the supporting level of 1.1000. On the one hand, it could potentially rebound from this support and form a range. On the other hand, the price of this asset might break the level of 1.1000 through, form a double top, and drop. In this case, it would be interesting to follow the candlestick formations to forecast the upcoming market sentiment.
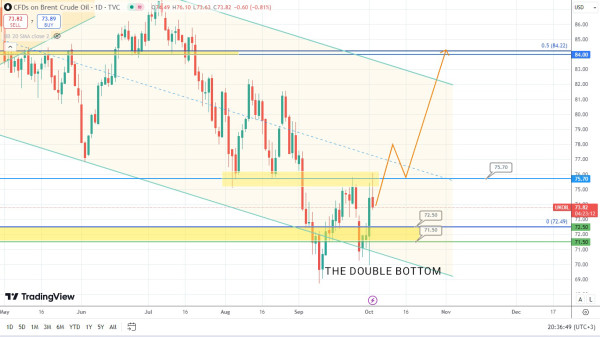
The price of Brent oil tested the bearish trap formed around the level of 72 and rebounded. Now, it is targeting the level of 75.70. It might eventually pull back from it and head north, simultaneously forming the double bottom. This is a very important and strong pattern, which usually signifies the formation of the ascending trend. So, let’s observe what might happen next.
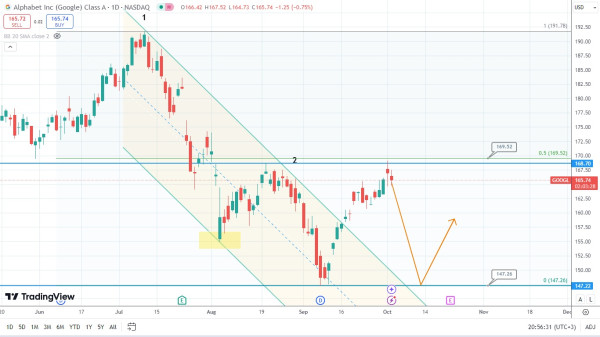
The price of the stocks of the Alphabet company owning Google broke the downtrend and reached the level of 168.70, which is located next to the middle point of the latest descending move, that is, 50% Fibonacci retracement level. The price of this asset might potentially undergo correction, drop, and then only rise again. Let’s see whether this scenario might work out.