EUR/USD, EUR/GBP and GBP/USD expected little changed during Columbus Day
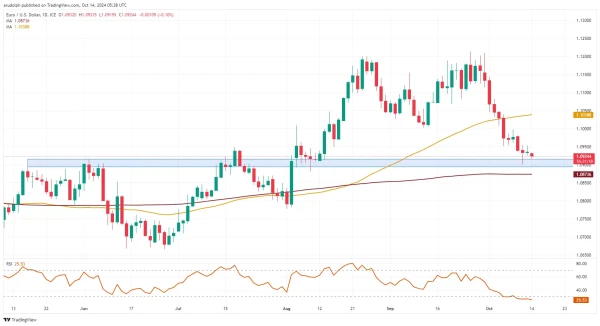
EUR/USD remains under pressure
EUR/USD continues to slide towards last week's $1.0900 low, below which lie the 8 August low at $1.0882 and the 200-day simple moving average (SMA) at $1.0874.
Minor resistance is still seen at the 4 October $1.0952 low and also at the 8 October $1.0997 high.
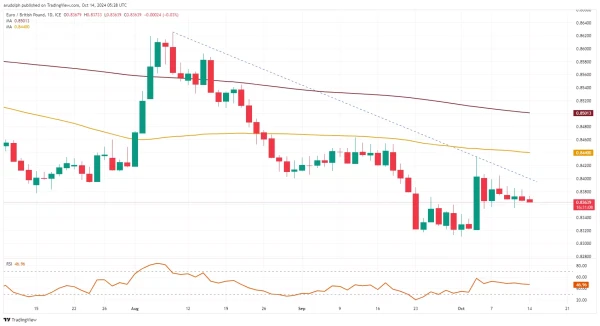
EUR/GBP slips
EUR/GBP remains under pressure and dips towards last week's low at £0.8355. Below this level sits the £0.8322-to-£0.8311 support zone.
Minor resistance is seen along the August-to-October tentative downtrend line at $0.8400.
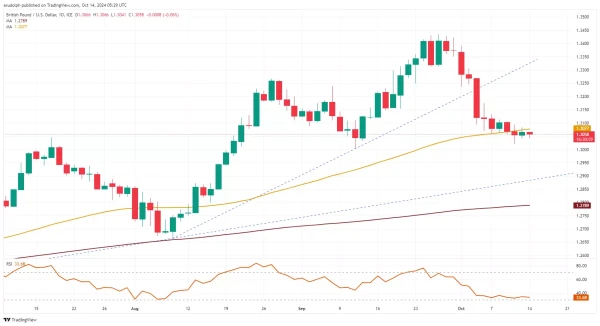
GBP/USD still has bearish bias
GBP/USD continues to trade below the 55-day SMA at $1.3077 which still acts as resistance. Were last week's low at $1.3022 to give way, the September low at $1.3002 would be in sight. This support level with the $1.3000 mark is key for the medium-term trend as a fall through it could lead to the 200-day SMA at $1.2789 being targeted.
While the $1.3000 mark underpins, the medium-term uptrend remains intact though. Minor resistance above the 55-day SMA can be found at the early September high at $1.3239.