EUR/USD Forecast: Potential Price Correction Ahead
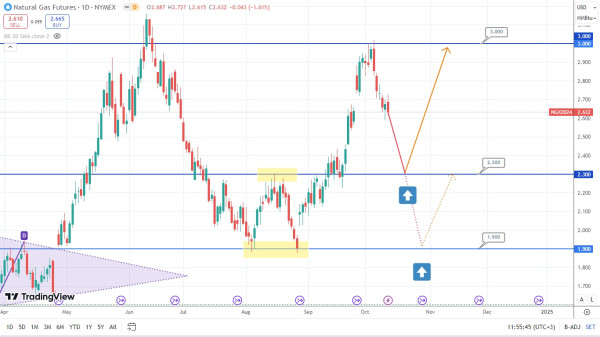
Last week, the price of natural gas jumped. After that, it rebounded from the resistance level of 3.0 and underwent correction at the end of the trading week. The price of this asset is likely to dive even deeper and gain the required support at the level of 2.3. Next, it might potentially rebound and rise. On the other hand, the price of gas might also drop to the supporting level of 1.9 and then only pull back up. At this point, it would be very important to follow the candlestick formations next to these supporting levels to forecast the upcoming market sentiment. So, let’s observe what the next price movement of this asset might be.
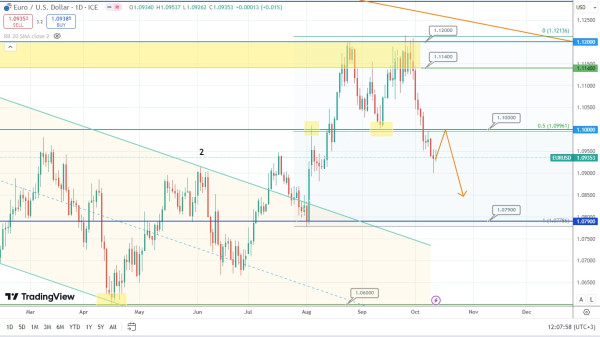
The price of the currency pair EUR/USD broke the neckline of the double top. Hence, it is possible to pull back to the broken horizontal level of 1.1000, drop to the level of 1.0790, and gain the required support.
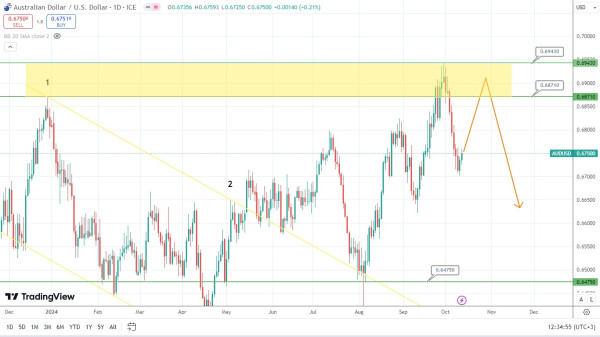
The price of the Australian dollar rebounded from the previously achieved maximum points and formed a rather large resistance area between levels 0.6871 and 0.6943. Once the price of this asset rebounds and retests this area, it might potentially drop and gain the required support at the level of 0.6600. Time will tell whether this scenario might work out.