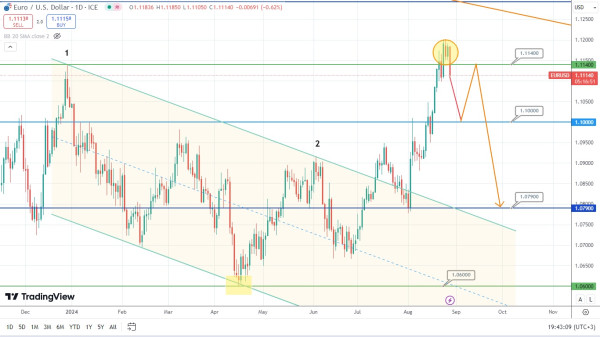
EUR/USD Forecast: Potential Price Drop Ahead
The price of the currency pair EUR/USD rebounded and dived under the broken resistance level of 1.1140, trying to form a fine bearish engulfing at the end of the trading day. This might also signify the completed formation of the bullish trap. Now, the price of this asset has dropped to the level of 1.1000. However, it might eventually break this level through and test the level of 1.0790 soon. So, let’s observe what is going to be the next price movement of this currency pair.
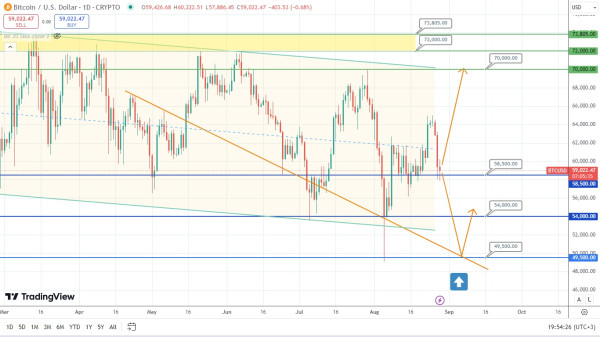
The price of Bitcoin has significantly dropped. Currently, the price of this asset is testing the level of 58500. It might mean that Bitcoin may not dive deeper. On the other hand, the asset’s price could potentially undergo correction and gain the required support at the level of 49500. This level is located next to the local weekly median line denoted by the red color on the chart below. Bitcoin might rebound from the crossing point of these two trendlines and jump. In any case, it would be wise to follow the price movements next to these technical trendlines.
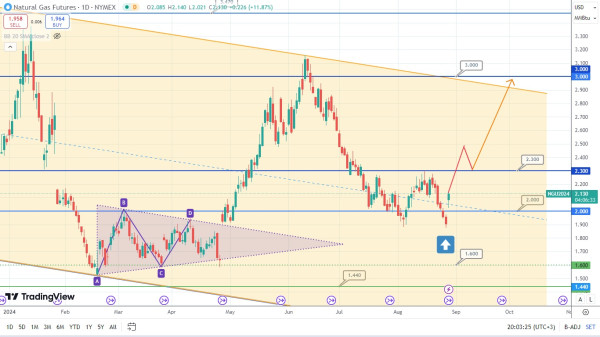
The price of natural gas has repeatedly tested the supporting level of 2.00 and rebounded. Now, it is targeting the level of 2.30. Should the price of this asset break this level through, it might target the psychological resistance at the level of 3.00 next. Time will tell whether this scenario might work out.