EUR/USD, GBP/USD and AUD/USD slide on US dollar safe haven inflows
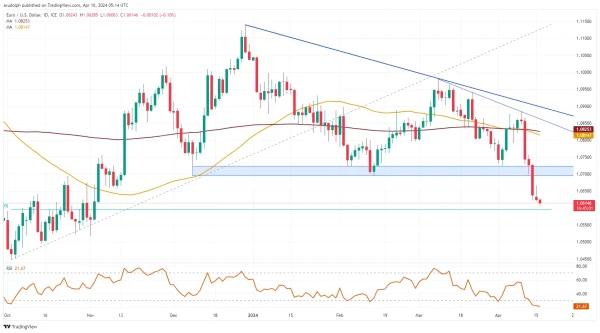
EUR/USD drops further still
Friday's EUR/USD fall through and daily chart close below its $1.0694 February low confirmed the resumption of the medium-term bear market which began in December with the $1.05 region being in focus.
The 78.6% Fibonacci retracement of the October-to-December advance at $1.0596 is next in line. Below it lies the late October lows at $1.0522 to $1.0517 as well as the $1.0449 October low.
Minor resistance can be spotted at the $1.064 mid-October high.
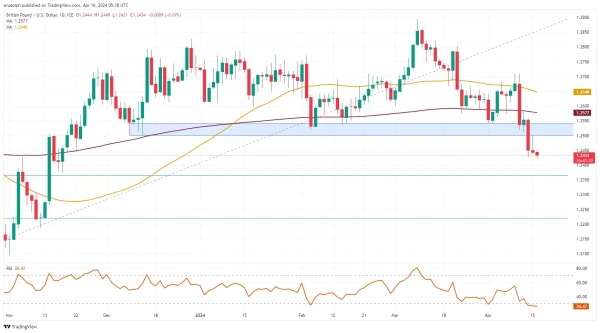
GBP/USD remains bearish
GBP/USD's fall through the $1.25 mid-December low reached the early November high at $1.2428 as expected. below it beckons the 61.8% Fibonacci retracement of the October-to-March rise at $1.2365.
Strong resistance sits at the previous $1.25 to $1.254 support zone which should thwart any potential attempt to the upside.
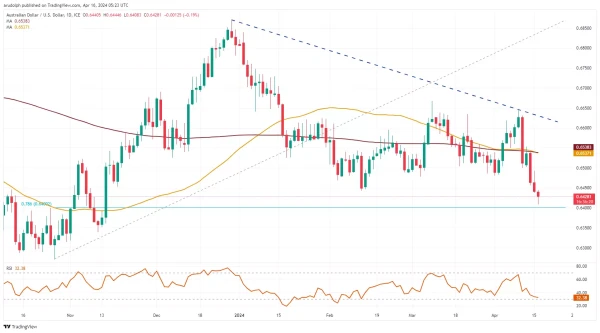
AUD/USD slips through key support
AUD/USD slipped to its $0.6443 February low, a fall through which would put the August and early September lows at $0.6366 to $0.6358 on the cards.
Minor resistance can now be seen at the $0.6443 mid-February low.