EUR/USD, GBP/USD, DXY Price Forecast: DXY Brace for US CPI and FOMC
Market Overview
The forthcoming economic events, notably, the U.S. Core CPI and CPI figures are under scrutiny. Currently, EUR/USD hovers around 1.0852, reflecting a subtle 0.04% dip, with a pivot point at 1.0839. The GBP/USD pair, trading at 1.2681, shows a slight increase of 0.03%. The market’s attention is now on the forthcoming events that could sway currency values.
Events Ahead
For EUR/USD, Italian Retail Sales data will be in the spotlight, expected at a 0.2% month-on-month change. GBP/USD traders will eye the RICS House Price Balance, anticipated at -6%.
Meanwhile, the U.S. Core CPI and CPI figures are anticipated to exhibit a month-on-month increase of 0.3%, slightly below the previous 0.4%, while the annual CPI is expected to ascend from 3.2% to 3.4%.
These inflation metrics will be instrumental in shaping the Federal Reserve’s monetary policy decisions, as detailed in the upcoming FOMC meeting minutes.
US Dollar Index (DXY)
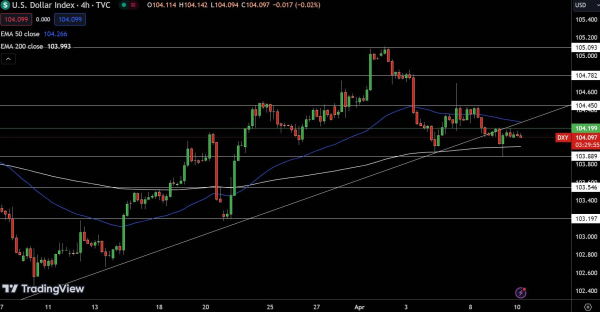
The Dollar Index slightly declined to 104.199, reflecting a minimal 0.01% decrease. It hovers around the 104.20 pivot, hinting at indecision. Key resistances at 104.45, 104.78, and 105.09 might cap upside movements.
Support lies at 103.89, 103.55, and 103.20, where potential rebounds could occur. With the 50-day and 200-day EMAs closely aligned at 103.88 and 103.81 respectively, the index presents a consolidated view.
The market’s stance is bearish below the 104.20 mark, yet surpassing this could indicate a bullish shift, making the current level critical for future direction.
EUR/USD Technical Forecast
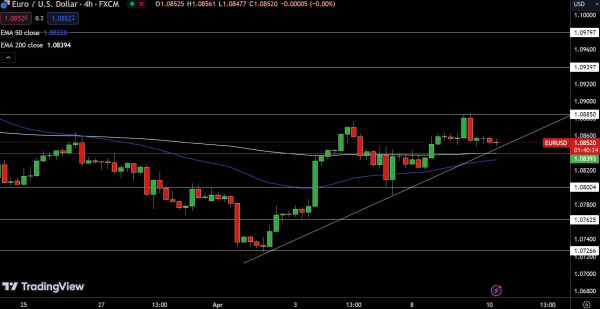
The EUR/USD steadied at 1.0852, slightly down. With the pivot at 1.0839, resistance lies at 1.0885 and 1.0939, hinting at potential upward movements. Support is set at 1.0800, with further dips possibly testing 1.0762.
The pair shows a cautious outlook, hinging on key levels of 1.0844 and 1.0819 from the 50 and 200-day EMAs, respectively.
A firm stance above 1.0844 could signal a bullish trend, while falling below could prompt significant sell-offs, reflecting the nuanced balance in market sentiment.
GBP/USD Technical Forecast
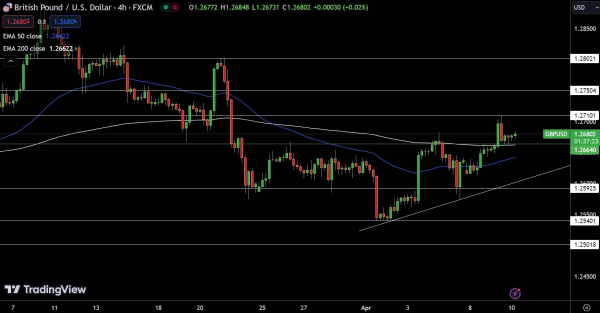
The GBP/USD edged up to 1.2681, marking a modest 0.03% increase. The pair’s resilience around the 1.2664 pivot point suggests potential for further gains, with resistance levels awaiting at 1.2710, 1.2750, and 1.2802.
On the downside, supports are established at 1.2593, 1.2540, and 1.2502, areas where buying interest could reemerge. The currency remains buoyed above its 50-day EMA at 1.2642 and slightly above the 200-day EMA at 1.2662, indicating a cautiously optimistic outlook.
The market stance is bullish as long as it maintains above 1.2664, but a dip below this threshold could precipitate a sharper selling pressure.
For a look at all of today’s economic events, check out our economic calendar.