EUR/USD, GBP/USD, DXY Price Forecast: DXY Breaks $104; US NFP Bolsters Trend
Market Overview
On Friday, the US Non-Farm Employment Change exceeded expectations at 303K, hinting at a resilient labor market, while the Unemployment Rate dipped to 3.8%. In Europe, German Industrial Production surged to 2.1%, signaling strength in the manufacturing sector, with the trade surplus widening to 21.4B. Conversely, the UK’s housing market showed signs of strain with the Halifax HPI marking a -1.0% change.
Events Ahead
Looking ahead, the market’s focus shifts towards upcoming economic indicators. The US Core CPI and CPI data, due for release on Wednesday, are under the spotlight, with forecasts at 0.3% monthly and 3.4% yearly, potentially influencing the Federal Reserve’s monetary policy decisions.
In the Eurozone, Sentix Investor Confidence is projected to improve to -8.3. For the UK, the market anticipates insights from MPC Member Breeden and updates on Retail Sales, with the BRC monitor expected to show a 1.8% year-over-year increase.
US Dollar Index (DXY)
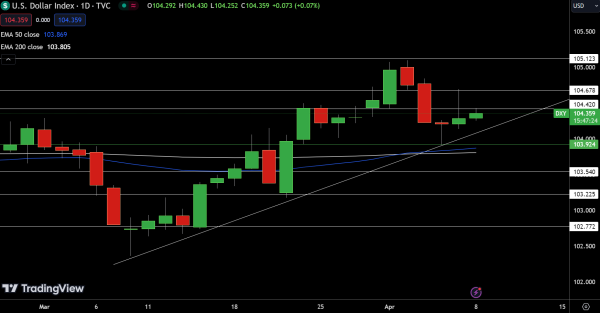
The Dollar Index modestly ascended to 104.359, exhibiting slight strength. With a pivot at $103.92, resistance levels are eyed at $104.42, $104.68, and $105.12, while support lies at $103.54, $103.23, and $102.77.
Technical indicators, including the 50-day and 200-day EMAs at $103.87 and $103.81 respectively, suggest a bullish trend, anchored slightly above the pivot.
A sustained move above $103.92 could reinforce this uptrend, but dipping below could trigger a significant bearish adjustment.
EUR/USD Technical Forecast
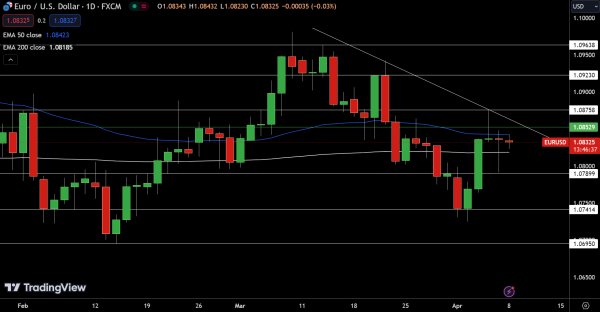
The EUR/USD pair slightly declined to 1.08325, marking a minimal decrease of 0.02%. The pivot point is set at $1.0853, with resistance levels at $1.0876, $1.0923, and $1.0964. Support levels are identified at $1.0790, $1.0741, and $1.0695.
Technical indicators, like the 50 EMA at 1.0842 and the 200 EMA at 1.0819, suggest a near equilibrium between buying and selling pressures. The current trend indicates a bearish bias below the $1.0853 pivot.
However, surpassing this pivot could tilt the scale towards a bullish outlook for the EUR/USD pair, reflecting the delicate balance in market sentiment.
GBP/USD Technical Forecast
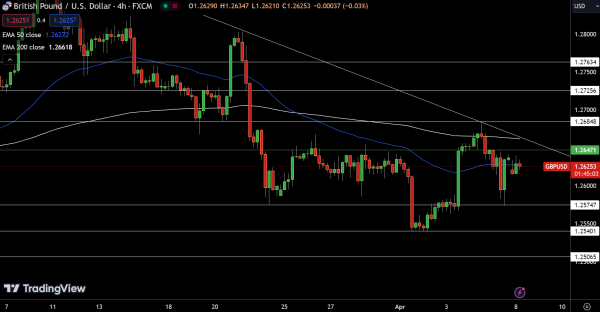
The GBP/USD pair marginally declined to 1.2625, showing a decrease of 0.06%. The critical pivot point is established at $1.2647. The currency faces resistance at $1.2685, $1.2726, and $1.2763, while support levels are found at $1.2575, $1.2540, and $1.2507.
The 50-day Exponential Moving Average (EMA) at 1.2627 and the 200-day EMA at 1.2662 suggest a narrow trading range, indicating potential market stability.
The trend for GBP/USD appears bearish below $1.2647, but surpassing this level could signal a shift towards bullish momentum, reflecting the market’s response to underlying economic factors.
For a look at all of today’s economic events, check out our economic calendar.