EUR/USD, GBP/USD, DXY Price Forecast: DXY Drops 0.24%, Will $102 Support Hold?
Market Overview
Last Friday was quite eventful for the currency markets. The GBP/USD pair saw mixed reactions after UK Retail Sales for July came in lower than expected at 0.5%, missing the forecast of 0.6%.
Meanwhile, the U.S. Building Permits for July dropped slightly to 1.40M, below the expected 1.43M, signaling potential cooling in the housing sector.
The U.S. Consumer Sentiment Index, however, exceeded expectations, rising to 67.8 from the forecasted 66.7, suggesting that consumer confidence is holding up better than anticipated.
The Dollar Index (DXY) reflected this optimism, hovering around 103.50, putting pressure on both the EUR/USD and GBP/USD pairs.
Events Ahead
Looking ahead, the focus will shift to upcoming U.S. economic data. On Monday, FOMC Member Waller’s speech at 13:15 and the CB Leading Index at 14:00 could further influence the Dollar Index.
Any hawkish remarks from Waller or a weaker-than-expected Leading Index reading could drive volatility in the EUR/USD and GBP/USD pairs.
US Dollar Index (DXY)
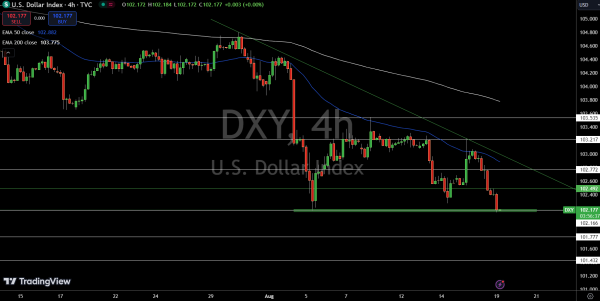
The Dollar Index (DXY) is currently trading at $102.154, reflecting a 0.24% decline. The index has been under pressure, with a “Three Black Crows” candlestick pattern suggesting continued selling momentum. Immediate support is near $102.166, where a double bottom pattern has formed. This level is critical; a breakout below it could lead to a sharper decline toward the next support at $101.777 and $101.432.
On the upside, resistance levels are at $102.772, followed by $103.217 and $103.535. The 50-day EMA at $102.882 and the 200-day EMA at $103.775 are both above current prices, indicating a bearish trend.
The outlook turns bullish above $102.175, but a break below this level could trigger a sharp selling trend.
EUR/USD Technical Forecast
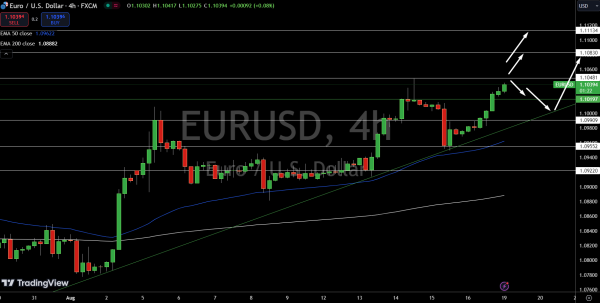
EUR/USD is currently trading at $1.10407, showing a modest gain as the pair continues its upward momentum. The pivot point at $1.10197 is crucial, with the price finding solid support near this level.
An upward trendline reinforces the bullish sentiment, suggesting that as long as EUR/USD stays above this pivot, the buying trend is likely to continue.
The formation of a “Three White Soldiers” candlestick pattern further indicates strong bullish momentum. Immediate resistance is at $1.10481, with further resistance at $1.10830 and $1.11134.
On the downside, immediate support is seen at $1.09909, followed by $1.09552 and $1.09220. Both the 50-day EMA at $1.09622 and the 200-day EMA at $1.08882 are trending upwards, supporting the ongoing bullish trend. The outlook remains bullish above $1.10197.
GBP/USD Technical Forecast
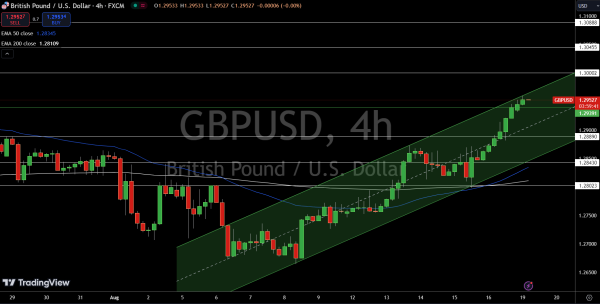
GBP/USD is currently trading at $1.29550, with the pair moving within an upward channel, indicating continued buying interest. The pivot point at $1.29391 is key to maintaining the bullish trend. Immediate resistance is found at $1.30002, with further resistance at $1.30455 and $1.30888.
On the downside, support levels are at $1.28890, followed by $1.28430 and $1.28023.
The 50-day EMA at $1.28345 and the 200-day EMA at $1.28109 are trending upwards, reinforcing the bullish outlook. The outlook remains bullish above $1.29391, but a break below this level could trigger a sharp selling trend.