EUR/USD, GBP/USD, DXY Price Forecast: DXY Falls to $105.85; Further Declines Expected?
Market Overview
The Eurozone’s inflation figures remained stable with the Final Core CPI y/y and Final CPI y/y both persisting at 2.9% and 2.4%, respectively, indicating a steady hold that mirrors ongoing cautiousness in the European Central Bank’s monetary policy approach. Additionally, the results from Germany’s recent 30-year bond auction showed yields softening to 2.52 from a previous 3.4, suggesting a declining investor interest in long-term Eurozone debt instruments.
In contrast, the UK’s inflation metrics released on Wednesday saw a Consumer Price Index increase to 3.2% y/y from 3.1%, and Core CPI y/y rising to 4.2% from 4.1%. These increments could pressure the Bank of England to consider tightening measures to address the rising inflation, potentially affecting the GBP’s value.
Events Ahead
- For the USD – Key data include Unemployment Claims, expected at 215K up from 211K; the Philly Fed Manufacturing Index projected to decrease to 1.5 from 3.2; and speeches by FOMC members which could provide further insights into the Federal Reserve’s future monetary policy.
- For the EUR – Notable are the Current Account, anticipated to show a surplus of 45.2B, up from 39.4B, signaling a strong economic position. Additionally, the German Bundesbank’s monthly report and Bundesbank President Nagel’s speech could offer deeper insights into Germany’s economic health.
US Dollar Index (DXY)
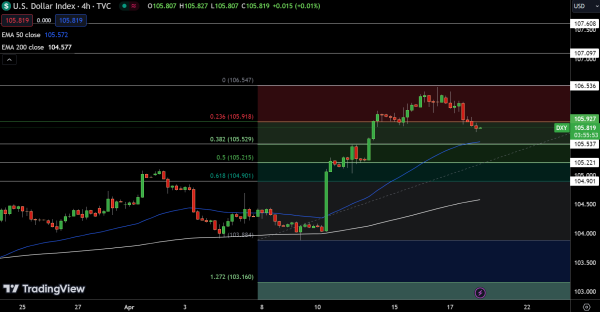
The Dollar Index is currently trading at 105.819, showing a decrease of 0.25%. It sits just below the pivot point of 105.927, hinting at potential downward pressure. Key resistance levels are established at 106.536, 107.097, and 107.608.
Conversely, the index finds immediate support at 105.537, with additional support points at 105.221 and 104.901.
The 50-day Exponential Moving Average (EMA) at 105.572 and the 200-day EMA at 104.577 both underscore a near-term bearish outlook, yet provide underlying support. The Dollar Index’s current stance is bearish below the pivot point of 105.927.
EUR/USD Technical Forecast
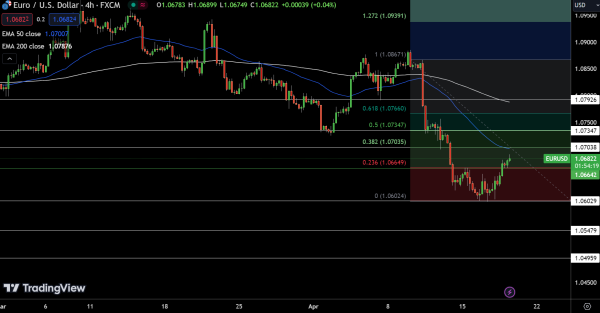
The EUR/USD pair is marginally up today at 1.06822, a 0.06% increase, reflecting subtle yet significant market movements. Currently, it trades above the pivot point of 1.0664, indicating a mild bullish bias.
Resistance levels are set at 1.0704, 1.0735, and 1.0793, which the pair might test if the upward momentum continues. Support levels are found at 1.0603, followed by 1.0548 and 1.0496, marking critical zones where buying pressure could intensify if breached.
The 50-day Exponential Moving Average (EMA) stands at 1.0701 and the 200-day EMA at 1.0788, suggesting potential resistance zones ahead. The EUR/USD exhibits a bullish stance above 1.0664.
GBP/USD Technical Forecast
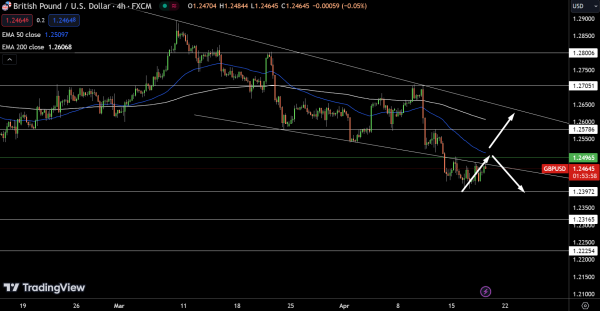
The GBP/USD pair is slightly up today, trading at 1.24645, marking a 0.12% increase. Positioned just below the pivot point of 1.2497, the pair’s near-term outlook appears cautious.
Resistance levels are delineated at 1.2579, 1.2705, and 1.2801, which could act as ceilings to upward movements. Conversely, support is identified at 1.2397, with further potential floors at 1.2317 and 1.2225.
The 50-day Exponential Moving Average (EMA) at 1.2510 and the 200-day EMA at 1.2607 both suggest resistance slightly above current levels. The GBP/USD shows potential for bearishness below the 1.2497 pivot.
For a look at all of today’s economic events, check out our economic calendar.