EUR/USD, GBP/USD, DXY Price Forecast: DXY Gains Support at $105.52; Buy Now?
Market Overview
Last Friday, the USD saw the release of key economic indicators. The Core PCE Price Index, indicating inflation, remained stable at 0.3% month-on-month. Similarly, the Revised UoM Consumer Sentiment held steady at 77.2.
In the Eurozone, the Spanish Flash CPI year-on-year stood at 3.3%, reflecting slight moderation. Meanwhile, in the UK, the GfK Consumer Confidence Index improved marginally to -19.
Events Ahead
While today lacks significant economic releases, market attention turns to tomorrow and Friday’s events. Tomorrow, the USD will unveil the Employment Cost Index, forecasted at 1.0% quarter-on-quarter, and the Chicago PMI, expected at 44.9.
Additionally, the CB Consumer Confidence is anticipated to reach 104.0. Friday brings pivotal US employment data: the Non-Farm Employment Change projected at 243K, Average Hourly Earnings at 0.3%, and the Unemployment Rate at 3.8%.
In the Eurozone, investors await the Italian 10-year Bond Auction and the German Prelim CPI, forecasted at 0.6%. These figures will offer insights into the health of respective economies, guiding market sentiment.
US Dollar Index (DXY)
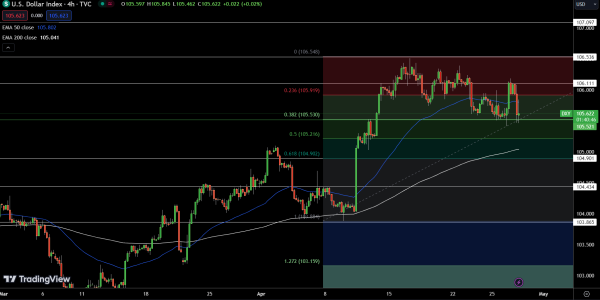
In today’s analysis of the Dollar Index, the price stands at $105.622, reflecting a decline of 0.46%. Chart data reveals pivotal levels: the pivot point rests at $105.521, with immediate resistance at $106.111, followed by $106.536 and $107.097. Conversely, support levels are at $104.901, $104.434, and $103.865, respectively.
Technical indicators underscore a bullish sentiment, with the 50-day Exponential Moving Average at $105.802 and the 200-day EMA at $105.041. The index remains bullish above $105.521, but a breach below this threshold could precipitate a pronounced selling trend.
EUR/USD Technical Forecast
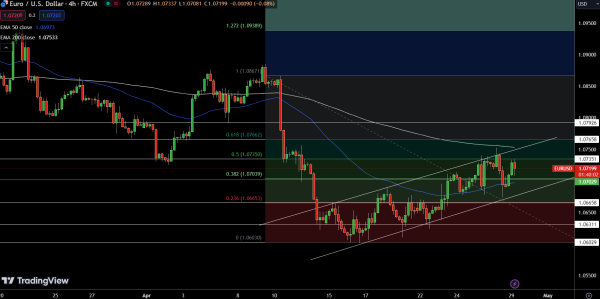
Today’s analysis of the EUR/USD pair reveals a price of $1.07199, marking a gain of 0.34%. Key price levels indicate a pivot point at $1.07029, with immediate resistance at $1.07351, followed by $1.07658 and $1.07926. Conversely, support levels are at $1.06658, $1.06311, and $1.06029.
Technical indicators highlight a bullish trend, with the 50-day Exponential Moving Average at $1.06973 and the 200-day EMA at $1.07533. The pair remains bullish above the pivot point of $1.07029, but a breach below this level could trigger a notable selling trend.
GBP/USD Technical Forecast
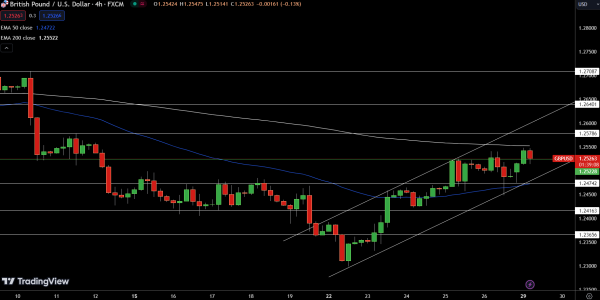
In today’s assessment of the GBP/USD pair, the price stands at $1.25263, reflecting a gain of 0.45%. Key price levels indicate a pivot point at $1.25228, with immediate resistance at $1.25786, followed by $1.26401 and $1.27087. Conversely, support levels are identified at $1.24742, $1.24163, and $1.23656.
Technical indicators reveal the 50-day Exponential Moving Average at $1.24722 and the 200-day EMA at $1.25522. The pair maintains a bullish trajectory above the pivot point of $1.25228; however, a breach below this level could initiate a significant selling trend.
For a look at all of today’s economic events, check out our economic calendar.