EUR/USD, GBP/USD, DXY Price Forecast: DXY Nears $105.500; Targeting $105 Today?
Market Overview
In yesterday’s review, the Advance GDP figures for the US showed a modest growth of 1.6%, slightly below expectations. Unemployment claims remained steady, while the GDP Price Index surged by 3.1%, signaling stubborn inflationary pressures.
Meanwhile, in the Eurozone, Spain’s unemployment rate saw a marginal increase, reaching 12.3%, reflecting ongoing labor market challenges.
Additionally, the UK’s CBI Realized Sales plummeted to -44, indicating a significant decline in sales activity, while GfK Consumer Confidence figures remained pessimistic, with a reading of -19.
Events Ahead
Looking ahead, significant events are on the horizon. In the US, investors will closely monitor Core PCE Price Index, Personal Income, and Personal Spending data releases, crucial indicators for gauging inflationary trends and consumer behavior.
Furthermore, revisions to the UoM Consumer Sentiment and Inflation Expectations, currently at 3.1%, will provide further insights into consumer sentiment and inflation outlooks.
In the Eurozone, attention will be on M3 Money Supply and Private Loans data, offering clues about the health of the region’s financial system and lending activities.
US Dollar Index (DXY)
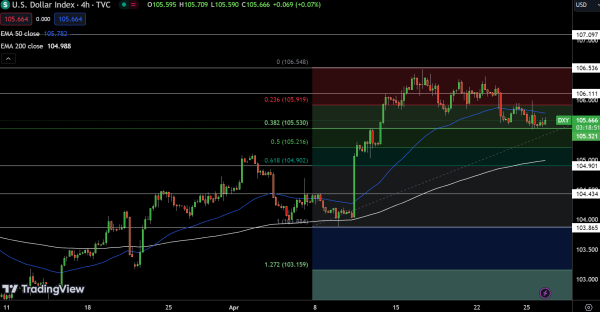
In today’s technical analysis of the Dollar Index, the price stands at $105.669, marking a slight increase of 0.09%. Analyzing the 4-hour chart timeframe, key price levels are identified, with the pivot point set at $105.521. Immediate resistance levels are observed at $106.111 and $106.536, while immediate support lies at $104.901, followed by $104.434 and $103.865.
Technical indicators, including the 50-day Exponential Moving Average (EMA) at $105.782 and the 200-day EMA at $104.988, offer further insights into market trends. With a bullish sentiment prevailing above $105.521, a breach below this level could trigger significant selling pressure.
EUR/USD Technical Forecast
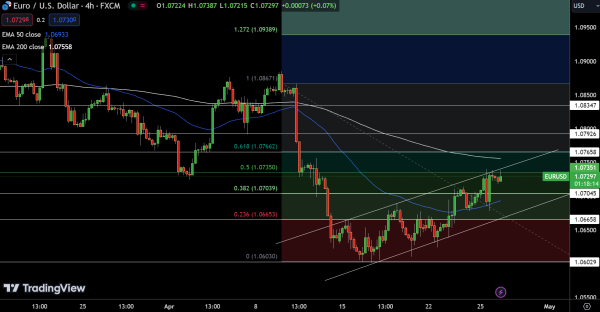
In today’s analysis of EUR/USD, the pair is priced at $1.07293, showing a slight decrease of 0.01%. Examining the 4-hour chart, pivotal price levels are identified, with the pivot point set at $1.07351.
Immediate resistance levels are noted at $1.07658, $1.07926, and $1.08347, while immediate support is observed at $1.07045, followed by $1.06658 and $1.06029.
Technical indicators, such as the 50-day Exponential Moving Average (EMA) at $1.06933 and the 200-day EMA at $1.07558, provide additional insights into market trends. With a bearish sentiment prevailing below $1.07351, a breakout above this level could indicate a shift towards a more bullish bias, and vice versa.
GBP/USD Technical Forecast
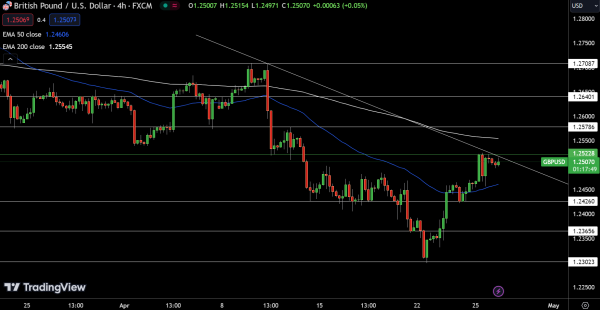
In today’s analysis of GBP/USD, the current price stands at $1.25067, reflecting a decrease of 0.05%. Assessing the 4-hour chart, pivotal price levels are identified, with the pivot point set at $1.25228. Immediate resistance levels are observed at $1.25786, $1.26401, and $1.27087, while immediate support lies at $1.24260, followed by $1.23656 and $1.23023.
Technical indicators, including the 50-day Exponential Moving Average (EMA) at $1.24606 and the 200-day EMA at $1.25545, offer additional insights into market trends. With a bearish sentiment prevailing below $1.25228, a breakout above this level could signify a shift towards a more bullish bias, and vice versa.
For a look at all of today’s economic events, check out our economic calendar.