EUR/USD, GBP/USD, DXY Price Forecast: DXY Slips Below $103; US CPI in Focus
Market Overview
On Wednesday, the UK’s CPI came in at 2.2%, slightly below the 2.3% forecast, while the Core CPI dropped to 3.3%, missing expectations of 3.4%.
The EUR/USD showed little movement following France’s Final CPI, which held steady at 0.2%, aligning with forecasts.
The Dollar Index remained resilient as inflation data confirmed steady U.S. economic conditions, holding at 3.0% year-on-year as expected.
Events Ahead
Looking ahead, the GBP/USD pair might see movement with the UK’s House Price Index (HPI) expected to rise by 2.6% compared to the previous 2.2%.
The EUR/USD could react to the Eurozone’s GDP and Industrial Production data; GDP is forecasted to remain stable at 0.3%, while Industrial Production is expected to improve slightly.
In the U.S., the Dollar Index could be influenced by upcoming Core CPI data, which is projected at 0.2%, indicating a potential shift in inflation trends.
US Dollar Index (DXY)
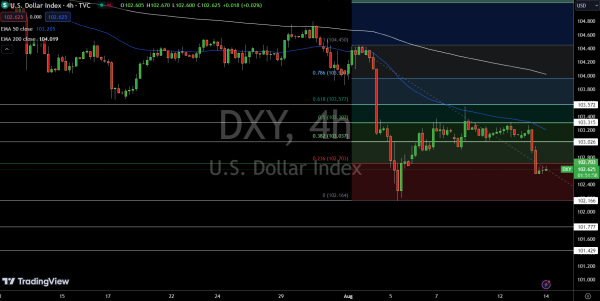
The Dollar Index (DXY) is trading at $102.625, up slightly by 0.01%, but it’s showing signs of weakness. The index recently broke below its previous sideways trading range of $103 to $103.315, indicating a shift in sentiment.
It’s now struggling to rise above the 23.6% Fibonacci retracement level, which is acting as resistance. The key pivot point at $102.703 is crucial; staying below it suggests further downside potential.
Immediate support is at $102.166, with additional levels at $101.777 and $101.429. If the index breaks above $102.703, we could see a shift back to a bullish bias.
EUR/USD Technical Forecast
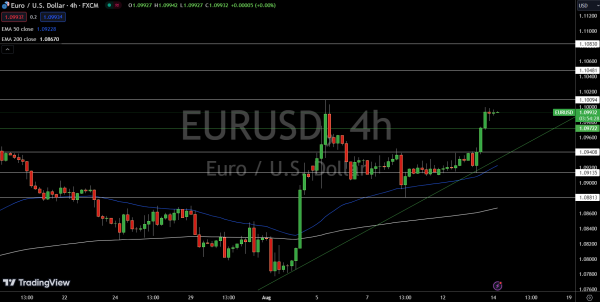
The EUR/USD is trading at $1.09932, down 0.02%, but the outlook remains bullish. On the 4-hour chart, the pair has formed a “three white soldiers” pattern, a sign of strong upward momentum that was initiated above the $1.09135 support level.
This support is reinforced by an upward trend line, and the bullish bias is further supported by the 50 EMA at $1.09228 and the 200 EMA at $1.08670, both indicating a buying trend.
The immediate resistance to watch is at $1.10094, which could limit the upside. However, as long as the pair stays above the $1.09722 pivot point, the bullish trend remains intact.
GBP/USD Technical Forecast
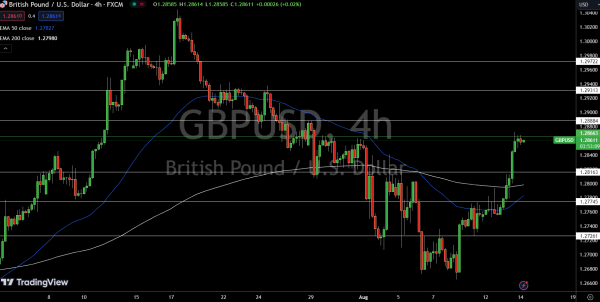
The GBP/USD is trading at $1.28611, down 0.03%, but the technical outlook remains positive. The pair has crossed above both the 50 EMA at $1.27827 and the 200 EMA at $1.27980, signaling a bullish trend.
The pivot point at $1.28663 is crucial; staying above it suggests continued upward momentum. Immediate resistance is at $1.28884, with further resistance at $1.29313 and $1.29722.
On the downside, if the pair breaks below the pivot, support levels at $1.28163 and $1.27745 could be tested. As long as GBP/USD holds above $1.28663, the bulls remain in control.