EUR/USD, GBP/USD, DXY Price Forecast: DXY Steady at $102.57, Retail Sales Key
Market Overview
Recent data releases have provided mixed signals, such as, the U.S. Consumer Price Index (CPI) met expectations, with a 0.2% increase month-over-month and a 2.9% year-over-year rise, slightly below the anticipated 3.0%.
These figures have kept the Dollar Index (DXY) relatively flat, currently trading at 102.57. Meanwhile, the UK’s GDP figures came in as expected, with no growth month-over-month and a 0.6% increase quarter-over-quarter, down from the previous 0.7%.
This stagnation suggests that the GBP/USD could face headwinds if economic conditions don’t improve.
Events Ahead
Looking ahead, several critical U.S. economic indicators are on the horizon. Core Retail Sales are expected to rise by 0.4%, while overall Retail Sales are forecasted to grow by 0.4%, up from 0.0% previously. These numbers could lend some strength to the Dollar Index if they meet or exceed expectations.
Additionally, the Unemployment Claims report is forecasted to come in at 236,000, slightly above the previous 233,000, which could indicate some softness in the labour market.
The Empire State Manufacturing Index and the Philly Fed Manufacturing Index will also be closely watched, with forecasts of -5.9 and 5.4, respectively.
Any significant deviations from these expectations could influence both EUR/USD and GBP/USD, as investors adjust their expectations for Federal Reserve policy moves.
US Dollar Index (DXY)

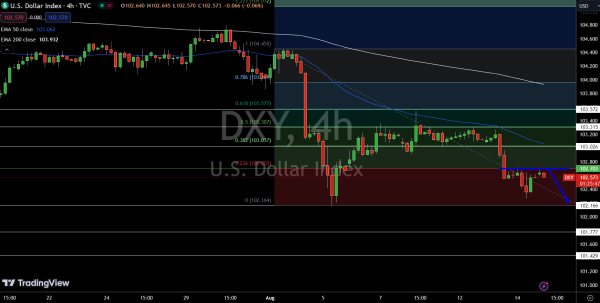
The Dollar Index (DXY) is currently trading at $102.570, essentially flat for the day. The index is hovering just below its pivot point at $102.703, indicating a potential bearish trend if it fails to break above this level.
Immediate support is found at $102.166, with further downside targets at $101.777 and $101.429. On the upside, resistance lies at $103.026, with additional barriers at $103.315 and $103.572.
The 50-day EMA at $103.062 is also acting as a key resistance level. A sustained move below $102.703 could signal further declines, while a break above may reignite bullish momentum.
EUR/USD Technical Forecast

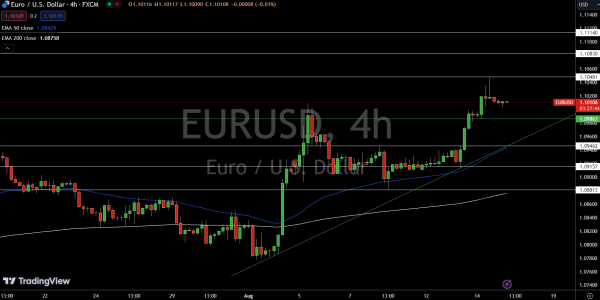
EUR/USD is currently trading at $1.10120, holding steady with no significant change. The pair have entered an overbought zone and recently formed a shooting star candlestick pattern on the 4-hour chart, signalling potential exhaustion among the bulls. This pattern, followed by the doji candles, indicates indecision among investors.
The immediate support level to watch is $1.09863, with a potential drop toward this level likely. If the pair tests this support and holds, we could see a bullish reversal.
However, a break below $1.09863 could trigger further selling, targeting the next supports at $1.09462 and $1.09157.
GBP/USD Technical Forecast

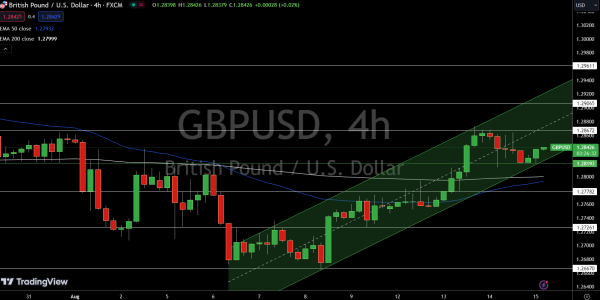
GBP/USD is trading at $1.28438, up 0.18% on the day. The pair is showing a slight bullish bias, supported by the formation of an ascending channel on the 4-hour chart. The immediate support is at $1.28193, just above the 50-day EMA at $1.27932.
As long as the price holds above this pivot point, the bullish trend is likely to continue, with immediate resistance at $1.28672, followed by $1.29065 and $1.29611.
However, a break below $1.28193 could signal a reversal, potentially driving the pair toward the next support levels at $1.27782 and $1.27261.