EUR/USD, GBP/USD, DXY Price Forecast: GBP Recovers as CPI Rises to 3.2%; DXY Steady
Market Overview
Inflation data in the UK showed a persistent upward trend. The Consumer Price Index (CPI) year-over-year increased slightly to 3.2% from 3.1%, while the Core CPI rose to 4.2% from 4.1%, indicating sustained inflationary pressures.
Additionally, Producer Price Index (PPI) inputs slightly decreased by 0.1%, and PPI outputs remained steady at 0.2%. These figures underscore ongoing cost pressures within the UK economy, potentially influencing the Bank of England’s (BoE) monetary policy direction.
The Retail Price Index (RPI) also reflected higher inflation, registering at 4.3% year-over-year.
Events Ahead
In the Eurozone, focus will remain on inflation metrics with the Final Core CPI and Final CPI both holding steady year-over-year at 2.9% and 2.4%, respectively. These stable figures will be critical as ECB President Christine Lagarde addresses the market, providing insights into the European Central Bank’s future policy moves.
For the U.S., the release of the Beige Book will offer valuable insights into regional economic conditions, potentially impacting the Federal Reserve’s decisions. Upcoming speeches by FOMC members Mester and Bowman will also be significant, as they may provide further clarity on the Fed’s stance towards inflation and interest rates.
US Dollar Index (DXY)
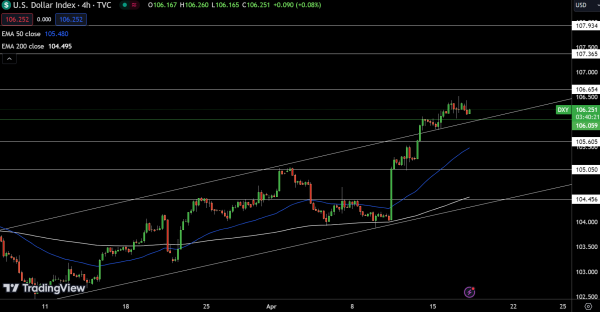
The Dollar Index marginally decreased by 0.02%, trading at 106.251. Despite this slight downturn, the index remains just above its pivot point at 106.059, indicating a potentially bullish stance if it can maintain above this threshold. Immediate resistance levels are identified at 106.654, 107.365, and 107.934. Surpassing these could signal further strength in the dollar.
Conversely, if the index falls below its pivot, it could test support levels at 105.605, 105.050, and 104.456, where a break below could trigger a more pronounced sell-off. The 50-day and 200-day Exponential Moving Averages, at 105.48 and 104.50 respectively, suggest that the long-term trend remains upward. Traders should watch the 106.059 level closely; staying above it might prevent a deeper decline and stabilize the index’s position.
EUR/USD Technical Forecast
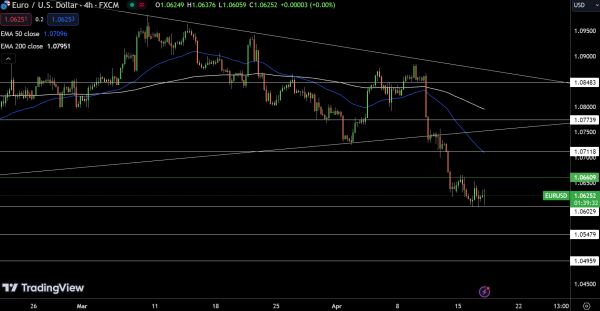
The EUR/USD pair saw a marginal increase, rising by 0.01% to trading at 1.06252. Positioned slightly below its pivot point of 1.0661, the pair shows potential resistance at 1.0712, with further barriers at 1.0774 and 1.0848 that could delineate a stronger bullish trend if surpassed.
Conversely, immediate support is found at 1.0603, followed by 1.0548 and 1.0496. Should the pair breach these levels, it could confirm a bearish trend. The 50-day Exponential Moving Average (EMA) at 1.0710 and the 200-day EMA at 1.0795 currently sit above the price, suggesting overhead resistance.
The current market posture for EUR/USD is cautiously bearish unless it can consistently trade above the 1.0661 pivot, which would shift the bias towards a more bullish outlook.
GBP/USD Technical Forecast
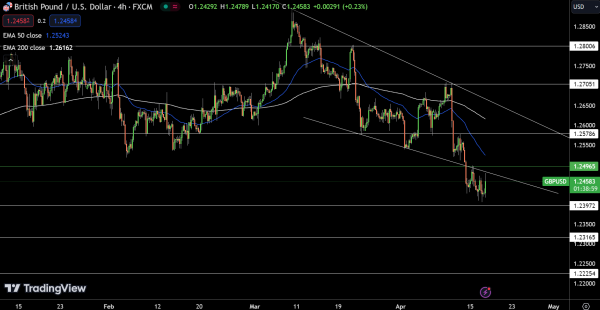
The GBP/USD pair recorded a slight decline, down 0.03%, settling at 1.24583. This movement places the pair below its pivot point of 1.2497, suggesting a tentative bearish stance in the market. Immediate resistance levels lie ahead at 1.2579, with further hurdles at 1.2705 and 1.2801. Overcoming these could pivot to a bullish trend.
Support levels are established at 1.2397, with additional supports at 1.2317 and 1.2225. If the pair breaks below these points, it might extend losses, confirming a bearish trend. The 50-day and 200-day Exponential Moving Averages, at 1.2524 and 1.2616 respectively, indicate resistance above the current price level.
The market outlook for GBP/USD remains cautious, trending bearish unless it crosses above the 1.2497 threshold, which would indicate potential for upward momentum.
For a look at all of today’s economic events, check out our economic calendar.