EUR/USD, GBP/USD likely to decline much further while EUR/GBP stabilises
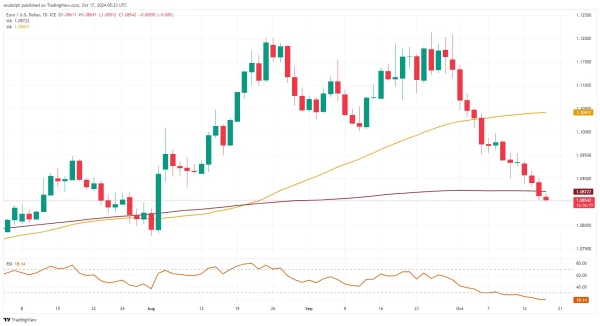
EUR/USD drops further
EUR/USD's fall through the 200-day simple moving average (SMA) at $1.0872 has now also turned our weekly forecast bearish with the August low at $1.0778 representing the next downside target.
Minor resistance above the 200-day SMA at $1.0872 can be spotted at the 1 October low at $1.0900.
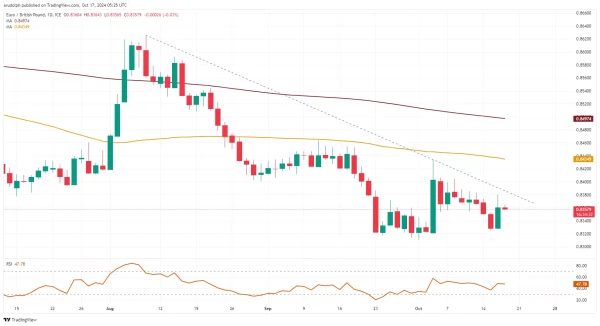
EUR/GBP bounces back
EUR/GBP recovered from the £0.8326-to-£0.8311 support zone amid weaker-than-expected UK inflation data. Were it to give way, the 21 March 2022 low at £0.8296 would be next in line, together with the January 2022 and December 2019 lows at £0.8285-to-£0.8277.
Minor resistance above Wednesday's £0.8380 high can be seen along the August-to-October downtrend line at £0.8385.
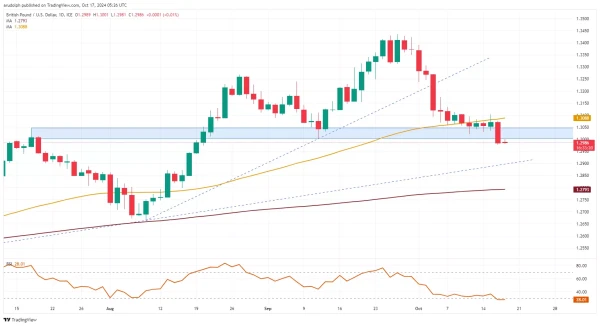
GBP/USD falls to two-month low
GBP/USD's tumble through the September low at $1.3022 and the $1.3000 mark following a weaker-than-expected UK inflation print changed our weekly outlook to a bearish one with the $1.2793-to-$1.2665 region being targeted. The tentative April-to-October uptrend line at $1.2898 represents the next downside target.
Because of inverse polarity previous key resistance at $1.3000-to-$1.3022 should now act as resistance.