EUR/USD, GBP/USD remain under pressure as EUR/GBP stabilises
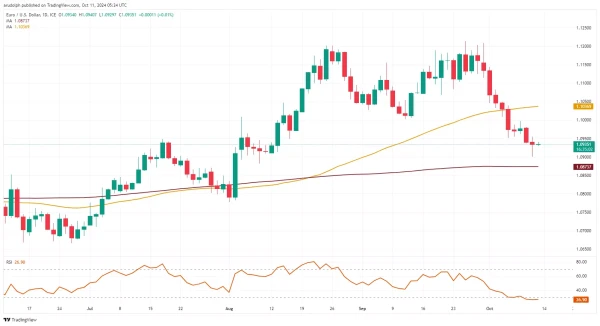
EUR/USD slips further
EUR/USD slips further towards its 8 August low at $1.0882 and the 200-day simple moving average (SMA) at $1.0874, around which it is likely to at least short-term hold.
Minor resistance is now seen at the 4 October $1.0952 low and also at the 8 October $1.0997 high.
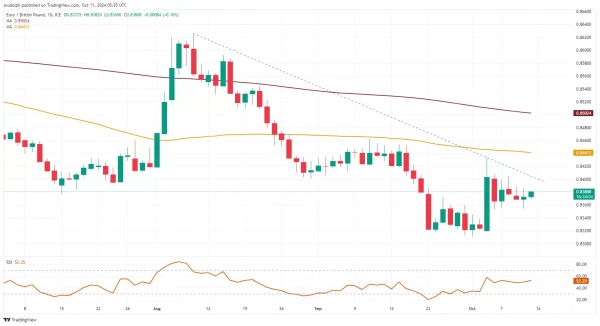
EUR/GBP sidelined
EUR/GBP remains sidelined below last week's near two-week high at £0.8434, made close to the 55-day SMA at £0.8441, and Thursday's and last Friday's low at £0.8355-to-£0.8354 from where it currently recovers.
Below this level sits the £0.8322-11 support zone.
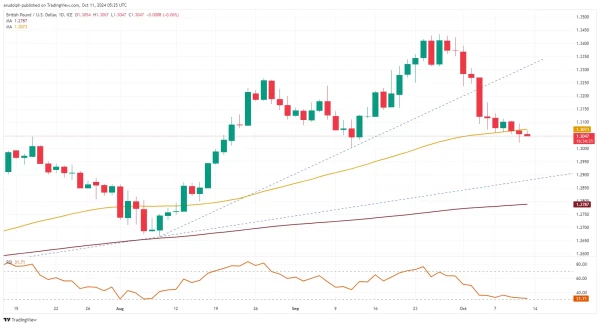
GBP/USD slides further
GBP/USD now trades below the 55-day SMA at $1.3073 which now acts as resistance. Were Thursday's low at $1.3022 to give way, the September low at $1.3002 eyed. This support level with the $1.3000 mark is key for the medium-term trend as a fall through it could lead to the 200-day SMA at $1.2787 being back in view.
While the $1.3000 mark underpins, the medium-term uptrend remains intact though. Minor resistance above the 55-day SMA can be found at the early September high at $1.3239.