EUR/USD, GBP/USD, USD/CAD, USD/JPY Forecasts – U.S. Dollar Retreats Ahead Of FOMC Minutes
U.S. Dollar
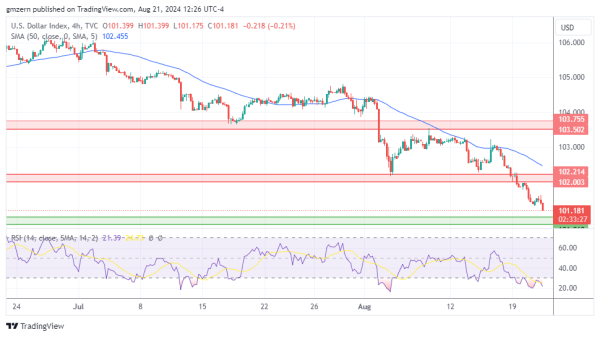
U.S. Dollar Index tests new lows as Treasury yields continue to move lower. The yield of 2-year Treasuries declined below the 3.95% level, while the yield of 10-year Treasuries settled below 3.80% level.
From the technical point of view, U.S. Dollar Index is heading towards the nearest support level at 100.80 – 101.00. RSI remains in the oversold territory, so the risks of a rebound are increasing.
EUR/USD
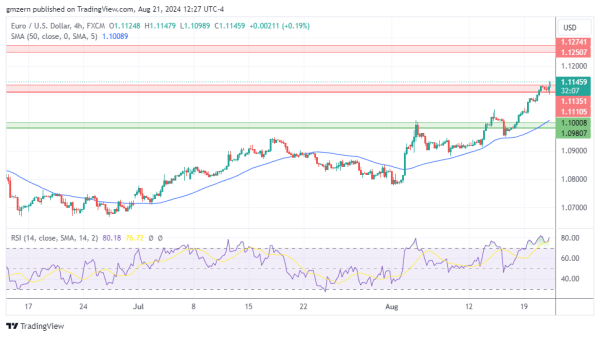
EUR/USD is trying to settle above the resistance at 1.1110 – 1.1135 as traders focus on falling Treasury yields.
In case EUR/USD moves above the 1.1150 level, it will head towards the next resistance at 1.1250 – 1.1275.
GBP/USD
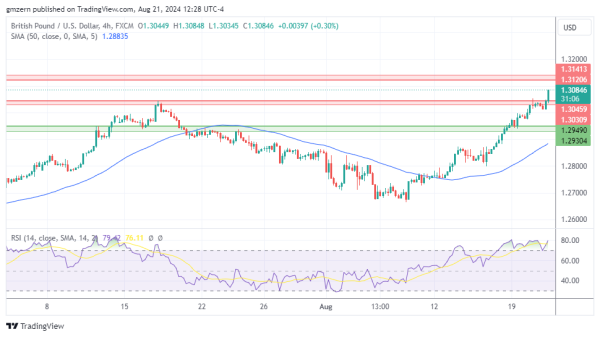
GBP/USD tests new highs as traders focus on general weakness of the American currency. Today, traders will have a chance to take a look at FOMC Minutes, which may put additional pressure on the American currency.
GBP/USD has recently moved above the resistance at 1.3030 – 1.3045. If GBP/USD climbs above the 1.3100 level, it will head towards the next resistance at 1.3120 – 1.3140.
USD/CAD
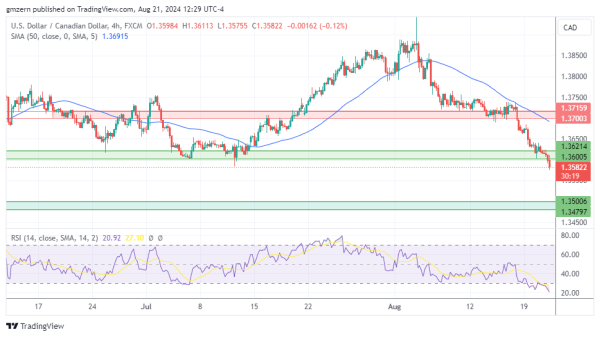
USD/CAD managed to get below the support at 1.3600 – 1.3620. RSI is in the oversold territory, but there is some room to gain additional momentum.
A move below the 1.3550 level will open the way to the test of the next support level, which is located in the 1.3480 – 1.3500 range.
USD/JPY
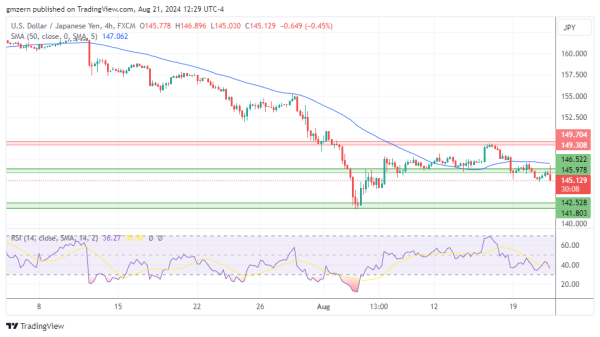
USD/JPY pulled back after an unsuccessful attempt to settle above the 146.50 level. From a big picture point of view, USD/JPY is moving lower as traders bet on dovish Fed.
In case USD/JPY declines below the 145.00 level, it will head towards the next support, which is located near August lows at 141.80 – 142.50. RSI is in the moderate territory, so there is plenty of room to gain additional downside momentum in the near term.
For a look at all of today’s economic events, check out our economic calendar.