EUR/USD, GBP/USD, USD/CAD, USD/JPY Forecasts – U.S. Dollar Tests New Lows As Traders Focus On Falling Treasury Yields
U.S. Dollar
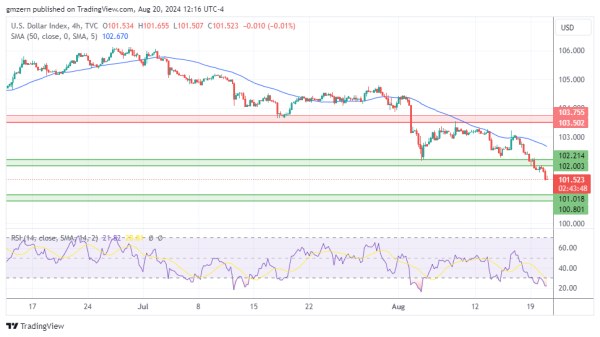
U.S. Dollar Index tests new lows as traders focus on the strong pullback in Treasury yields. The yield of 2-year Treasuries declined towards the 4.00% level, while the yield of 10-year Treasuries settled below 3.85%.
U.S. Dollar Index has recently managed to settle below the support at 102.00 – 102.20 and is trying to settle below the 101.50 level. In case this attempt is successful, U.S. Dollar Index will head towards the next support at 100.80 – 101.00.
EUR/USD
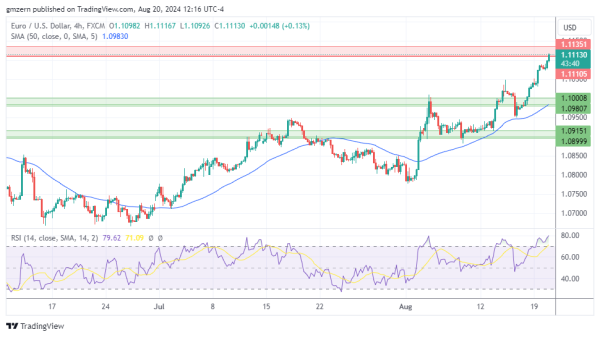
EUR/USD tests resistance at 1.1110 – 1.1135 as traders focus on general weakness of the American currency.
It should be noted that RSI is in the extremely overbought territory, so the risks of a pullback are increasing.
GBP/USD
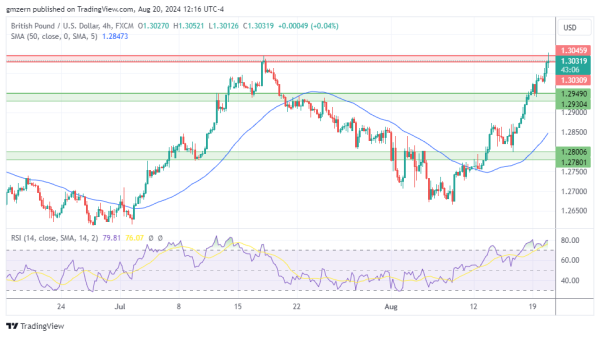
GBP/USD has also managed to gain strong upside momentum and moved towards the resistance at 1.3030 – 1.3045. Traders prepare for the Jackson Hole Symposium and bet on dovish Fed.
A move above the 1.3045 level will push GBP/USD towards 1.3100. RSI is in the extremely overbought territory so it remains to be seen whether GBP/USD will be able to settle above the resistance at 1.3030 – 1.3045 in the near term.
USD/CAD
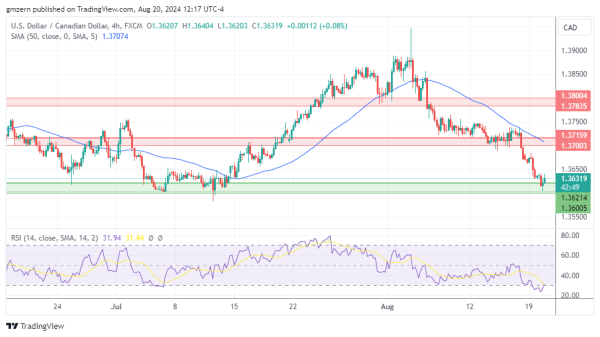
USD/CAD is mostly flat as traders ignore the pullback in the oil markets. Other commodity-related currencies are moving higher in today’s trading session.
In case USD/CAD climbs back above the 1.3650 level, it will head towards the nearest resistance, which is located in the 1.3700 – 1.3715 range.
USD/JPY
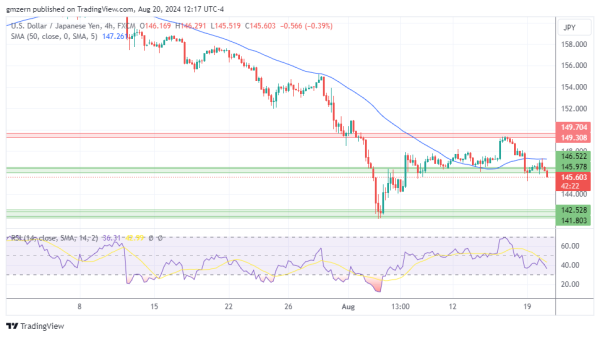
USD/JPY is losing ground as traders stay focused on falling Treasury yields. RSI remains in the moderate territory, so there is enough room to gain additional downside momentum.
A successful test of the support at 146.00 – 146.50 will open the way to the test of the next support level at 141.80 – 142.50.
For a look at all of today’s economic events, check out our economic calendar.